

0 引言
近年来,遥感技术由于数据易获取、监测范围大等优势被广泛应用于城市生态环境监测领域,成为生态环境评价的有效手段[4-6]。基于遥感数据的生态质量评价方法很多,如基于植被指数的植被覆盖分析[7]、基于水体指数评估水环境[8-10]、利用热岛温度评价城市热岛效应[11-12]。但是,这些方法都是基于单因素的生态质量评价。事实上,生态环境受到多种因素的共同影响,单一遥感指数无法客观、全面地反映区域生态质量变化。因此,在此基础上徐涵秋[13]提出了基于遥感的生态指数,该指数集成了最为直观反映生态环境的绿度、湿度、干度和热度4项指标,并利用主成分分析法得到权重,从而实现对区域生态质量的客观评价,这种方法近年在城市生态评价研究中也得到了广泛应用[14-16]。
1 研究地区和数据来源
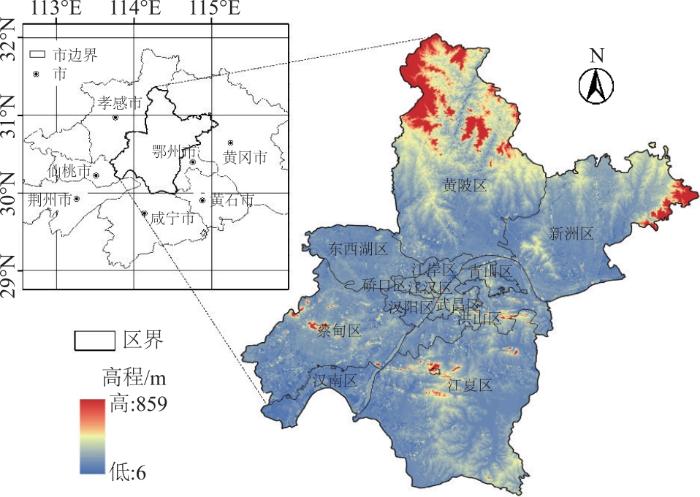
1.1 研究地区概况
1.2 数据来源
本文数据来源主要有3部分。
(1)高程数据(Digital Elevation Model,DEM):武汉市DEM数据,来自地理空间数据云。
(3)土地利用数据:1985—2023年的土地利用(Land Use and Land Cover Change,LUCC)数据源于中国土地覆盖数据集(China Land Cover Dataset,CLCD)[25],该数据集利用Landsat数据构建时空特征,结合随机森林分类器得到分类结果,并运用包含时空滤波和逻辑推理的后处理方法进一步提高了结果的时空一致性,总体准确率达到80%。该数据集将中国土地利用类型划分为农田、草地、不透水面等9种。
本文选取2014年、2017年、2020年、2023年四景土地利用数据分析武汉市近10 a土地利用情况,后续进行生态质量计算时不包含水体。
2 研究方法
2.1 遥感生态指数
遥感生态指数模型利用遥感影像数据计算绿度指标(归一化植被指数)、湿度指标(土壤湿度WET)、干度指标(归一化土壤指数NDSI)和热度指标(地表温度LST),再运用主成分分析法客观赋权,提取第一主成分后进行归一化处理得到RSEI指数,从而对研究区生态质量进行综合评估[26]。
2.1.1 绿度指标NDVI
2.1.2 湿度指标WET
TM数据:
OLI数据:
式中:ρblue、ρgreen、ρred、ρnir、ρswir1、ρswir2分别为TM和OLI数据蓝、绿、红、近红外、短红外1、短红外2波段的反射率。
2.1.3 干度指标NDSI
2.1.4 热度指标LST
热度指标是指Landsat热红外波段经过反演得到的地表温度。Landsat8 TIRS选取B10来反演地表温度[32],Landsat7 ETM数据则基于B6反演。计算式为:
式中:Lλ为传感器处光谱辐射亮度;DN为像元值;T为传感器处温度; K1、K2为波段校准常数; gain为频带缩放的增益因子;bias为频带缩放偏置因子。
传感器处温度经过比辐射率纠正得到LST,即
式中:λ表示TM传感器B6和OLI传感器B10的中心波长,ρ=1.438×10⁻²mk;ε表示表面发射率,纠正后的LST即地表温度。
2.1.5 综合生态指数的构建
由于各分量在数值单位和大小上的差异,在综合之前需要对数据进行归一化处理。计算式为
式中:Ii为某因子的像元值;Imin和Imax分别表示各指标的最小和最大值。经式(10)归一化后,采用主成分分析法(Principal Component Analysis,PCA)对4个生态指标进行线性变换得到第一主成分(PC1)[33]。计算式为
式中:PC1为计算得到的第一主成分。RSEI0为转置后结果,RSEI0_max、RSEI0_min分别为 RSEI0的最大值和最小值。
最终得到的RSEI区间为[0,1],值越大表示生态环境质量越好。最后结合徐涵秋[26]的研究成果将RSEI以0.2为间隔分为5个等级。
2.2 空间自相关
3 研究结果
3.1 武汉市生态环境质量时空分布
统计2014—2023年武汉市遥感生态指数时空分布(图2)后发现,在时间上武汉市生态环境质量整体呈现波动性上升趋势。其中2014—2017年生态环境质量上升最为明显,RSEI均值由0.57增加到0.64,鉴于武汉市自2005年开始生态环境的不断恶化[34],本次上升很大程度上得益于自2010年开展的各项生态保护行动的有效落实[35];2017—2020年生态质量稍有下降,RSEI均值由0.64降为0.61,这是城市社会经济快速发展以及生态保护政策时滞效应共同作用的结果;2020—2023年生态质量均值上升至0.63,这是由于疫情导致的建设放缓以及前期“园林城市”建设、湿地保护等生态保护措施的持续作用[36-38]。
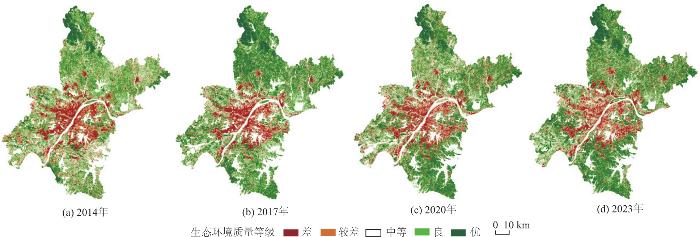
分析武汉市各等级RSEI面积及占比(表1)可以发现,武汉市生态环境质量较为稳定,高质量区域逐渐增多。从整体来看,2014年、2017年、2020年、2023年武汉市生态环境质量中等以上面积占比分别为77.96%、80.55%、77.23%、79.58%,稳定在80%左右,整体生态条件较好。从研究期间变化趋势来看,生态环境质量等级为优的区域占比明显增加,而等级为中等的区域变化趋势与之完全相反。这说明在研究期间可能有部分区域生态质量由中等转化为良或优,反映了武汉市对于耕地等生态条件中等区域的整治效果较为明显;等级为良的区域占比缓慢下降;差和较差的区域占比基本趋于稳定。
表1 武汉2014—2023年各等级RSEI面积及占比Table 1 Areas and proportions of different RSEI grades in Wuhan (2014-2023) |
| RSEI | 生态环境 质量等级 | 2014年 | 2017年 | 2020年 | 2023年 | |||||||
|---|---|---|---|---|---|---|---|---|---|---|---|---|
| 面积/km2 | 比例/% | 面积/km2 | 比例/% | 面积/km2 | 比例/% | 面积/km2 | 比例/% | |||||
| [0.8, 1.0] | 优 | 1 156.71 | 15.55 | 2 182.58 | 30.38 | 1 995.60 | 27.08 | 2 427.57 | 32.52 | |||
| [0.6, 0.8) | 良 | 2 650.32 | 35.62 | 2 465.14 | 34.32 | 2 265.20 | 30.37 | 2 234.06 | 29.93 | |||
| [0.4, 0.6) | 中等 | 1 993.37 | 26.79 | 1 138.75 | 15.85 | 1 457.77 | 19.78 | 1 278.37 | 17.13 | |||
| [0.2, 0.4) | 较差 | 974.34 | 13.10 | 760.01 | 10.58 | 921.10 | 12.50 | 850.45 | 11.39 | |||
| [0, 0.2) | 差 | 664.84 | 8.94 | 637.18 | 8.87 | 730.90 | 9.92 | 673.72 | 9.03 | |||
3.2 武汉市生态环境质量时空变化
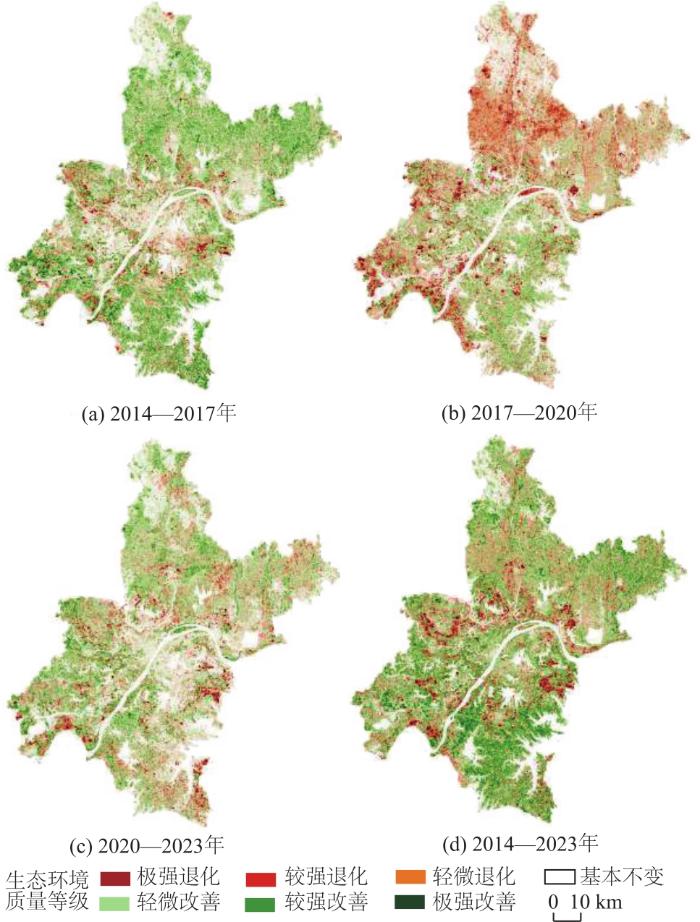
图3 武汉2014—2023年RSEI时空变化分级Fig.3 Classification of RSEI spatiotemporal changes in Wuhan (2014-2023) |
表2 武汉2014—2023年RSEI时空变化各等级面积及占比Table 2 Areas and proportions of RSEI spatiotemporal changes at different grades in Wuhan (2014-2023) |
| 变化类型 | 变化等级 | 2014—2017年 | 2017—2020年 | 2020—2023年 | 2014—2023年 | ||||||||||
|---|---|---|---|---|---|---|---|---|---|---|---|---|---|---|---|
| 面积/km2 | 比例/% | 面积/km2 | 比例/% | 面积/km2 | 比例/% | 面积/km2 | 比例/% | ||||||||
| 极强退化 | 123.87 | 258.93 | 164.70 | 223.24 | |||||||||||
| 退化 | 较强退化 | 207.14 | 15.16 | 491.32 | 32.41 | 271.18 | 19.92 | 351.26 | 21.56 | ||||||
| 轻微退化 | 776.88 | 1 596.26 | 1 003.77 | 993.43 | |||||||||||
| 基本不变 | 2 904.10 | 39.73 | 3 139.47 | 43.36 | 3 261.76 | 45.14 | 2 278.83 | 31.34 | |||||||
| 轻微改善 | 2 328.87 | 1 424.79 | 1 923.27 | 2 068.88 | |||||||||||
| 改善 | 较强改善 | 722.65 | 45.11 | 258.26 | 24.23 | 464.02 | 34.94 | 947.70 | 47.09 | ||||||
| 极强改善 | 245.62 | 70.83 | 137.76 | 407.64 | |||||||||||
| 生态质量变化整体评分 | 0.065 4 | -0.028 9 | 0.026 3 | 0.062 6 | |||||||||||
从空间分布来看,武汉市生态环境质量整体呈改善趋势,沉湖湿地、安山湿地等重要生态保护区呈现极强改善,中心城区主要为轻微改善和较强改善,汉南区、东湖高新技术开发区以及东西湖区等地由于城市建设开发出现了局部退化现象。
分析各时间段RSEI变化情况所占面积大小及百分比(表 2)发现,退化情况主要发生于2017—2020年期间,退化占比达到32.41%,其中大部分为轻微退化;而改善阶段主要为2014—2017年,改善占比达到45.11%。此外2020—2023年也有明显改善情况,改善占比超过1/3。9 a间,改善区域远多于退化区域,说明武汉市生态环境质量存在显著提升。
3.3 武汉市生态环境质量空间聚集性
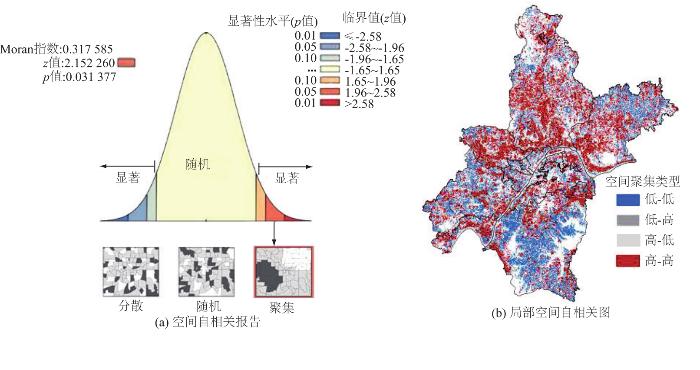
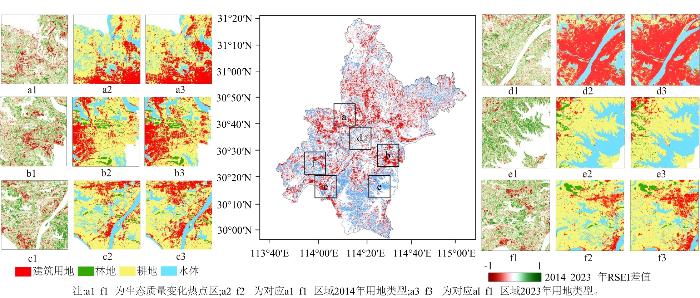
具体来看,可识别出六处生态质量变化热点区域(图5中a1、b1、c1、d1、e1、f1),通过对比热点区域2014年和2023年用地类型将其按变化原因分为3类:持续的开发建设活动使得中心城区周边平原地带生态质量锐减,东西湖区南部(图5中a2、a3)、江夏区东北部(图5中b2、b3)以及汉南区东北部(图5中c2、c3)建设用地扩张明显,部分地区RSEI降幅可达0.581,是以上变化过程的典型代表;与之相对,旧城区绿化设施的逐渐完善有助于生态质量的提升,如汉口、汉阳区域(图5中d2、d3)随着江滩生态公园建设的不断完善,区域生态环境质量平均上升0.065;另外,河湖湿地周边区域生态保护行动的有效开展也是生态质量上升的主要因素,江夏区南部梁子湖周边(图5中e2、e3)林地明显增多,该区域生态环境质量平均上升0.148,蔡甸区(图5中f2、f3)湿地范围内的建设用地有所减少,整体RSEI上升了0.125。
3.4 生态环境质量对土地利用变化的动态响应
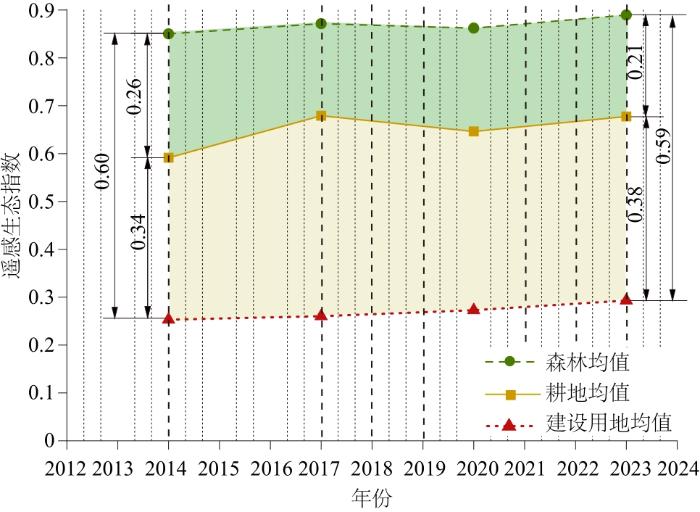
2014—2023年研究区域各用地类型中,森林转化面积74.11 km2,耕地(农田)转化面积433.3 km2,建设用地(不透水面)转化面积3.39 km2,详见表3。三者转化面积之和超过整体转化面积的85%,是研究区域最主要的用地类型,因此选择这三者作为研究对象。为进一步分析3种用地类型的生态质量变化情况,采用1 km×1 km的渔网提取研究区域各年份的RSEI,并利用分区统计工具,统计3种用地类型RSEI的均值变化情况,具体结果见图6。作为重要的自然生态系统,森林的RSEI均值在研究期间有轻微波动但整体上升,由2014年的0.850上升至2023年的0.890,增幅4.7%。耕地和建设用地作为两大人工生态系统,表现出不同的变化趋势,耕地的RSEI均值在2017年至2020年有轻微下降但整体呈上升趋势,由2014年的0.591增加到2023年的0.678,增幅达到14.6%。而建设用地的生态质量在研究期间平稳上升,9 a间RSEI均值由0.253上升至0.293。
图6 武汉市2014—2023年森林、耕地、建设用地RSEI变化趋势Fig.6 Trend of RSEI changes of forest, cultivated land and construction land in Wuhan City from 2014 to 2023 |
表3 武汉市2014—2023年土地利用转移矩阵Table 3 Land use transfer matrix in Wuhan from 2014 to 2023km2 |
| 土地利用类型 | 不透水面 | 草地 | 灌木 | 裸地 | 农田 | 森林 | 水体 | 2023年总计 | |||
|---|---|---|---|---|---|---|---|---|---|---|---|
| 不透水面 | 992.69 | 0.75 | 0 | 0.09 | 252.96 | 0.54 | 16.27 | 1 263.29 | |||
| 草地 | 0.00 | 0.19 | 0.00 | 0 | 0.61 | 0.01 | 0.01 | 0.82 | |||
| 灌木 | 0.00 | 0.00 | 0.00 | 0.00 | 0.00 | 0.00 | 0.00 | 0.00 | |||
| 裸地 | 0.00 | 0.04 | 0.00 | 0.06 | 0.02 | 0.00 | 0.11 | 0.23 | |||
| 农田 | 0.55 | 0.64 | 0.00 | 0.03 | 5 216.27 | 73.46 | 262.4 | 5 553.35 | |||
| 森林 | 0.00 | 0.26 | 0.01 | 0.00 | 103.28 | 563.09 | 0.17 | 666.8 | |||
| 水体 | 2.84 | 0.01 | 0.00 | 0.00 | 76.43 | 0.1 | 1 010.88 | 1 090.27 | |||
| 2014年总计 | 996.08 | 1.89 | 0.01 | 0.18 | 5 649.57 | 637.19 | 1 289.84 | ||||
| 用地转化量 | 3.39 | 1.70 | 0.01 | 0.12 | 433.3 | 74.11 | 278.96 | ||||
| 未发生转化面积 | 7783.19(90.73%) | 发生转化面积 | 794.94(9.27%) | ||||||||
注:数字下划线表示未发生转化面积。 |
由此可见,近10 a内由于耕地生态水平的不断提升,耕地向建设用地转化所需的生态成本不断扩大,遥感生态指数转化差值由2014年的0.34增加到2023年的0.38。这表明,随着近几年耕地生态质量的快速上升,未来对于城市开发扩张可能需要更加慎重,因为耕地向建设用地转化的生态成本逐渐增加。
3.5 浅析不同用地类型生态质量变化的潜在原因
研究期间武汉市耕地生态质量水平提升最为明显,可能与耕地保护政策有关。武汉市从2020年开始耕地“非农化”“非粮化”专项清理活动,清退了耕地中的违规建设,同时也提高了荒地的生态质量[41];武汉市建设用地的生态质量也有明显上升,尤其是两江交汇处的汉口、汉阳地区。随着我国进入高质量发展阶段,武汉市城市规划建设更加注重生态修复以及人居环境综合改善。一方面,随着社会经济发展,武汉中心城区的产业结构在不断优化,逐渐由现代化服务业取代传统工业,从而导致生态质量较差的工业厂房搬离市区[42]。另一方面,随着武汉市提出创建生态园林城市,各项生态修复和园林绿化方案也相应出台,使得人居环境的生态质量得到优化;武汉市森林生态水平稳步提升,可能与全球气候变暖、二氧化碳浓度提升有关[43],但也离不开武汉市长期坚持的生态保护行动。
4 结论与建议
(1)武汉市生态质量在2014—2023年整体呈波动性上升趋势,生态质量较好(平均RSEI由0.57上升至0.63)。各区域RSEI变化迥异,建设区域外围环状区域生态质量存在明显的下降,中心城区以及河湖湿地周边地区生态质量有所上升,而北部黄陂区的生态质量波动明显。在未来发展过程中要结合社会经济需求放缓增量,加强对存量空间的盘活利用,避免开发建设导致生态质量下降。
(2)研究期间,武汉市生态质量改善区域较多(47.09%),退化区域较少(21.56%)。两江交汇处的中心城区以及河湖湿地周边是生态质量改善的热点区域,表明城市更新和湿地修复对生态质量提升有实质性作用,未来应当持续推进旧城区景观提升和湿地保护等生态治理行动;城镇化发展带来的建设开发使得江夏区东北部等新建开发区成为生态质量退化的热点区域。
(3)武汉市生态质量变化和用地类型转化的关系密切。研究期间,武汉市森林、耕地和建设用地的生态质量都呈上升趋势,而耕地生态质量的增长速率超过了森林和建设用地,使人工环境内部(耕地与建设用地)的生态质量差异逐渐增大,耕地向建设用地转化的生态成本也越来越高。后续城市发展过程中要尽可能避免此类建设行为,要进一步加强耕地保护,避免耕地侵占和林地毁坏。
武汉市后续的生态治理工作应在遵循社会经济发展的前提下,结合区域生态质量变化聚集情况,针对生态热点区域采取因地制宜的措施,结合区域自然条件,丰富景观类型,提升生态质量。通过转变武汉市增量发展模式,加强对存量建设用地的生态化更新来提高建设用地生态质量;通过持续推进山体和湿地生态修复,加强武汉市绿色基础设施建设来增加生态空间,从而提升武汉市整体生态水平。