

0 引言
气候变化显著改变全球降水的时空分布,降水呈现强烈的区域性差异[1-2]。由此引发的水文情势演变问题持续受到国内外关注[3-4],成为当前水科学研究的核心议题[5]。研究显示,中国降水变化趋势区域分化明显,西北地区增幅最大,华北地区降幅最显著。同时,降水强度普遍增加,但年均降水日数呈下降趋势[6]。这一趋势不仅影响了中国的水资源状况,也对农业、生态系统和社会经济产生了深远影响。具体而言,我国极端降水事件整体呈增加趋势,但在华北、东北等地区则呈减少趋势,这些趋势具有明显的空间分异性[7-8]。关于水文情势演变的研究也逐渐扩展至多区域。例如,研究发现长江流域的降水变化在空间和时间上都呈现出复杂的波动特征,且该地区的极端降水指数增加[9]。黄淮海平原地区的地下水储量变化除与气候变化有所关联外,更多地受到人类活动的影响[10] 。
近年来,国际上对高原山地水文情势演变的关注度显著提升。例如,研究表明喜马拉雅地区的水文变化对跨境水资源管理提出了严峻挑战,特别是在水资源分配和生态保护方面[11] 。喀喇昆仑山—喜马拉雅山脉地区的水资源变化不仅受到气候变暖的驱动,还与冰川融化和冻土退化密切相关[12] 。喜马拉雅地区是澜沧江—湄公河、怒江—萨尔温江和伊洛瓦底江等多条重要国际河流的发源地,其水文变化对下游流域的水资源分布和生态安全具有深远影响。而西南诸河中的澜沧江、怒江和伊洛瓦底江三大河流中游区受“通道—阻隔”效应、气候变化与人类活动共同作用,水文水资源变化同样较为复杂[13-14]。研究指出,岭谷地形对水汽输送的阻隔作用显著影响区域降水的空间分布,这种效应在季风区尤为明显[15] 。此外,受气候变化的影响,跨境水资源管理及有关的生态水文问题在东南亚地区也日益突出[16]。尤其是澜沧江—湄公河流域,上下游不同的径流变化趋势及不确定性为水资源分配与生态保护带来新的挑战[17] 。
1 研究区概况
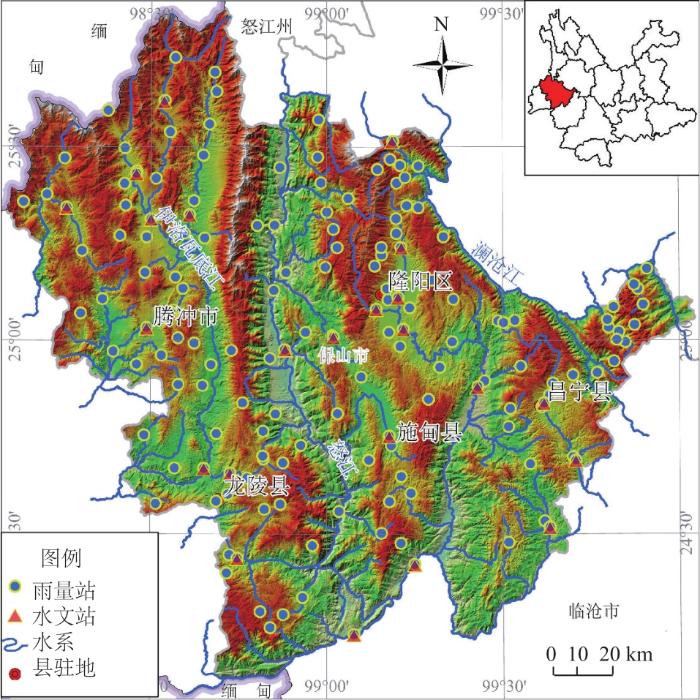
本文以保山市作为西南诸河流域的代表区域开展相关研究。保山市(24°08'N—25°51'N、98°05'E—100°02'E)位于云南省西部,面积为19 066.5 km2。东邻大理白族自治州,南界临沧市,北接怒江傈僳族自治州,西北和西南与缅甸接壤。地处横断山脉南端,主要山脉包括高黎贡山、怒山和云岭,西南诸河中的澜沧江、怒江和伊洛瓦底江三大水系自北向南贯穿全市,流域延伸至南亚和东南亚7国。区域呈现北高南低的山地地貌特征,受季风、西南暖湿气流和复杂地形的影响,降水量与水资源总量在时间和空间上分布不均,年际变化较大。多年平均降水量为1 545 mm,空间分布上,降水自北向南、由西向东逐渐递减。
2 数据及研究方法
2.1 数据来源
本文使用的降水和水资源数据来源于云南省水文水资源局保山分局的监测数据,数据均由水文专业人员观测、整编,经过上级主管单位复核,确保可靠性和代表性。使用1956—2016年保山境内151个雨量站(图1)的年降水数据,平均站网密度为1.6站/(200 km2),其中澜沧江水系18个站点,怒江水系79个站点,伊洛瓦底江水系54个站点。采用泰森多边形法计算三大水系的区域降水量,并通过等值线法估算区域水资源量。
2.2 研究方法
采用Mann-Kendall(M-K)趋势检验分析区域降水和水资源的年际变化;应用滑动T检验和M-K突变检验法识别突变年份;利用Morlet小波分析法提取周期性特征。
2.2.1 M-K秩次相关检验法
M-K秩次分析是用来评估气候要素时间序列趋势的非参数检验方法。该方法为世界气象组织推荐方法,具有适用范围广、人为干预小、定量化程度高的特点[20]。
假设存在时间序列长度为n的数据组 ,进行如下统计量的计算,即
其中,
统计量S的方差为
式中 是第i组数据点的数目。
统计量Z由式(4)计算。
通过比较统计量Z与临界值进行显著性检验。当Z为正值时,表示增加趋势;Z为负值时,表示减少趋势。当Z的绝对值≥1.96或≥2.58时,分别表示趋势在α=0.05和α=0.01水平上显著。对于显著趋势的站点,采用M-K突变分析进一步识别时间序列的突变点,即趋势发生显著变化的时间点[21]。
2.2.2 滑动T检验
滑动T检验通过比较滑动窗口前后两子序列的均值差异,检验数据序列中是否存在突变点[22]。具体方法是根据设定的时间步长,将数据序列划分为若干子序列,通过检验各子序列均值差异的显著性来判断是否发生突变。若均值差异显著,则表明存在突变;若差异不显著,则无突变。为准确识别出突变年份,尝试选用不同的步长分析。
2.2.3 小波分析
小波分析是研究水文过程中非平稳、多尺度时间序列周期性和非周期性特征的有效工具,选用复Morlet小波对降水和水资源序列进行分析[23]。即
式中: 为 的复共轭函数; 为对应于不同尺度不同位置的小波(变换)系数;f (t)是已知的信号;a是尺度因子,代表周期长度;b 是时间平移长度。
上述分析采用R软件(版本4.3.0)进行。M-K趋势及突变检验分别采用 “EnvStats”和“rkt” 包计算。
3 结果分析
3.1 水文情势特征值分析
总体上西南诸河流域保山地区三大水系水资源丰富,产水模数为78.83×10⁴ m3/km2。澜沧江、怒江、伊洛瓦底江及全市的降水量和水资源量偏差较小,表明年际变化较为稳定(表1)。降水量和水资源量的偏度系数均>0,呈现正偏态分布,说明均值位于众数右侧,频率较低。三大水系及全市降水量峰度系数均<0,表明数据分布较为一致且平坦;地表水资源量峰度系数存在差异,澜沧江、怒江水系峰度系数>0,显示数据分布较为陡峭。
表1 1956—2016年均降水量及水资源量统计特征Table 1 Statistical characteristics of annual precipitation and water resources (1956-2016) |
| 水系 | 降水量 | 地表水资源量 | |||||||||
|---|---|---|---|---|---|---|---|---|---|---|---|
| 平均值/mm | 标准偏差 | 偏度系数 | 峰度系数 | 最大值/ 最小值 | 平均值/(108 m3) | 标准偏差 | 偏度系数 | 峰度系数 | 最大值/ 最小值 | ||
| 澜沧江 | 1 233.7 | 169.15 | 0.48 | -0.24 | 1.80 | 10.81 | 2.83 | 0.80 | 1.10 | 3.52 | |
| 怒江 | 1 302.8 | 151.49 | 0.38 | -0.12 | 1.75 | 59.34 | 11.63 | 0.58 | 0.04 | 2.26 | |
| 伊洛瓦底江 | 2 056.0 | 227.09 | 0.06 | -0.65 | 1.58 | 82.05 | 13.92 | 0.16 | -0.55 | 2.22 | |
| 全市 | 1 545.41 | 167.17 | 0.22 | -0.66 | 1.56 | 152.20 | 26.44 | 0.24 | -0.62 | 2.01 | |
3.2 水资源变化的趋势特征
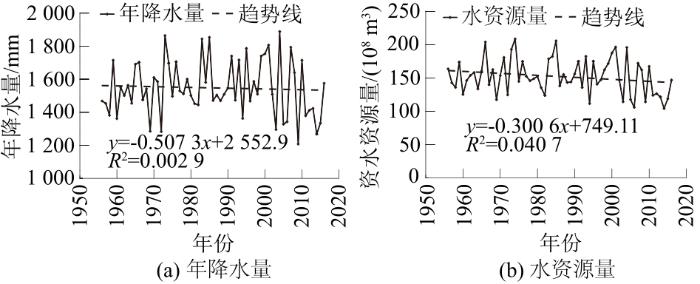
图2 保山市年降水量与水资源量年际趋势Fig.2 Interannual trends of precipitation and total water resources in Baoshan City |
表2 保山市降水量和水资源量多年平均时段线性趋势分析Table 2 Linear trend analysis of precipitation and water resources in Baoshan City over multi-year average periods |
| 年限 | 降水量倾向率/(mm·a-1) | 降水量M-K统计量 | 水资源量倾向率/(108 m3·a-1) | 水资源量M-K统计量 | |||||||||||||
|---|---|---|---|---|---|---|---|---|---|---|---|---|---|---|---|---|---|
| 澜沧江 | 怒江 | 伊洛瓦 底江 | 全市 | 澜沧江 | 怒江 | 伊洛瓦 底江 | 全市 | 澜沧江 | 怒江 | 伊洛瓦 底江 | 全市 | 澜沧江 | 怒江 | 伊洛瓦 底江 | 全市 | 临界值 | |
| 1956—2016 | 0.911 | -0.112 | -1.658 | -0.507 | 0.597 | -0.290 | -0.933 | -0.317 | -0.024 | -0.100 | -0.175 | -0.301 | -1.27 | -1.307 | -1.543 | -1.319 | 1.68 |
| 1956—1969 | 8.806 | 1.843 | -1.133 | 1.666 | 1.040 | 0.712 | 0.055 | 0.383 | 0.033 | -0.069 | 0.052 | 0.016 | -0.383 | -0.274 | 0.164 | -0.055 | 1.76 |
| 1970—1979 | -3.159 | 2.573 | -4.133 | -0.330 | -0.447 | -0.089 | -0.447 | -0.268 | -0.142 | -0.386 | -1.099 | -1.627 | -0.447 | -0.447 | -1.163 | -0.626 | 1.81 |
| 1980—1989 | -16.335 | -3.338 | 4.749 | -2.162 | -1.342 | -0.089 | 0.268 | 0.447 | -0.069 | -0.110 | 0.412 | 0.233 | -0.089 | 0.089 | 0.089 | 0.447 | 1.81 |
| 1990—1999 | -3.258 | -2.174 | 11.443 | 2.233 | -0.089 | -0.089 | 0.626 | 0.089 | -0.110 | 0.217 | 0.182 | 0.290 | -0.268 | 0.268 | -0.268 | 0.268 | 1.81 |
| 2000—2009 | -36.007 | -39.789 | -14.015 | -30.774 | -1.521 | -1.342 | -0.984 | -0.984 | -0.779 | -3.584 | -0.964 | -5.325 | -1.699 | -1.699 | -0.626 | -1.521 | 1.81 |
| 2010—2016 | -5.136 | -22.686 | -30.575 | -23.261 | -0.15 | -0.721 | -0.751 | -0.451 | 0.247 | -0.153 | -2.086 | -3.366 | -1.051 | -1.051 | -1.051 | -1.051 | 1.89 |
阶段性趋势分析(表2)显示研究区在2000—2016年进入相对干旱期:三大水系同步出现降水衰减,其中怒江衰减速率(-31.2 mm/a)高于区域均值。值得注意的是,与其余两个流域不同,澜沧江流域1956—1969年呈现独特的水文正相关(降水量增加率8.806 mm/a,水资源量增加率0.033×108 m3/a)。同期,伊洛瓦底江与怒江则表现为水文负相关。
3.3 水资源变化的突变特征
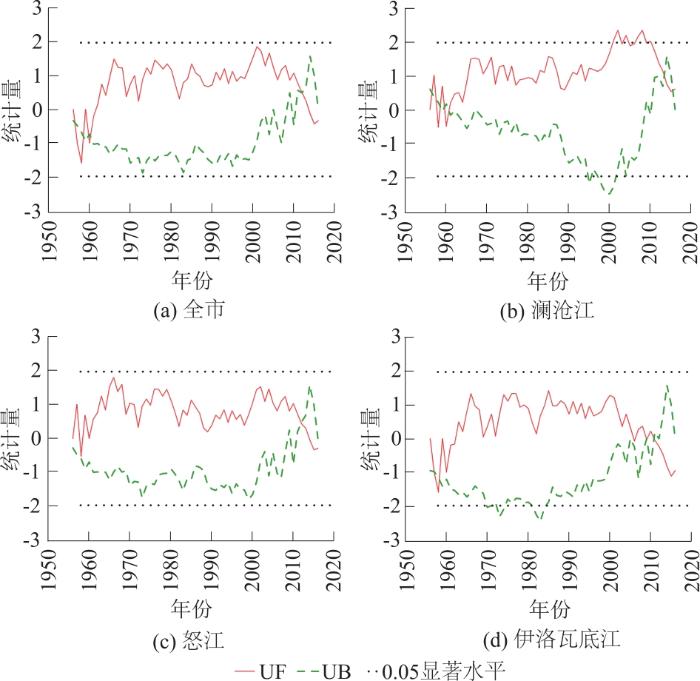

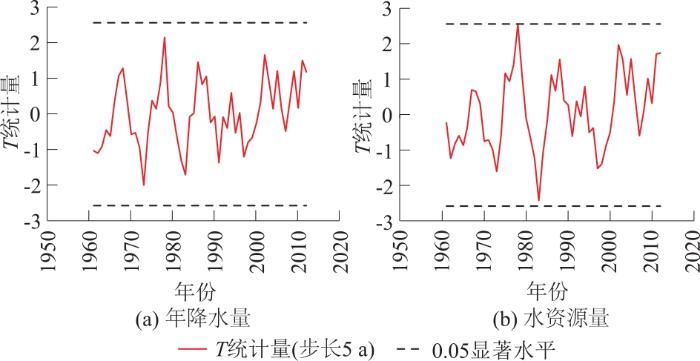
全市年降水量UF与UB曲线的交点出现于1960年和2012年(图3(a)),而澜沧江、怒江、伊洛瓦底江的年降水量曲线分别在2013年、2012年和2011年相交于临界值范围内(图3(b)—图3(d))。尽管如此,由于年降水量曲线未呈现明显的趋势变化,未发现统计显著的突变点。对于滑动T检验,本文尝试了3~7 a步长的分析。步长为3 a的分析显示,降水量在1999年达到α=0.05的显著水平,标志着降水量在1999年突变;1999年前后的年均降水量分别为1 559 mm和1 510 mm,降幅为3.1%。在同样的步长下,怒江、伊洛瓦底江和保山市的水资源总量T统计量未达到显著性水平,未识别出突变年份。然而,当步长为5 a时,澜沧江的水资源量在2009年和2011年出现显著性突变。
对于水资源量,M-K突变分析显示保山市的UF与UB曲线在1958年和2011年出现交点(图4(a)),而澜沧江、怒江和伊洛瓦底江的曲线分别在2009年、2011年和2011年相交(图4(b)—图4(d))。尽管如此,由于年水资源量曲线未显示显著变化,未检测到突变点。滑动T检验(步长为3 a)结果表明,保山市水资源量在1983年、1986年和1999年分别出现显著性突变,年均水资源量从突变前155.59×10⁸ m3降至突变后144.08×10⁸ m3,减少了7.4%。在4~7 a步长的分析中,除澜沧江流域在2009年、2011检测到突变外(步长5 a),其他水系的水资源总量也未显示突变(图5)。
3.4 水资源变化的周期性

图6 保山市年降水量、水资源量小波系数等值线Fig.6 Wavelet coefficient contour map of annual precipitation and total water resources in Baoshan City |
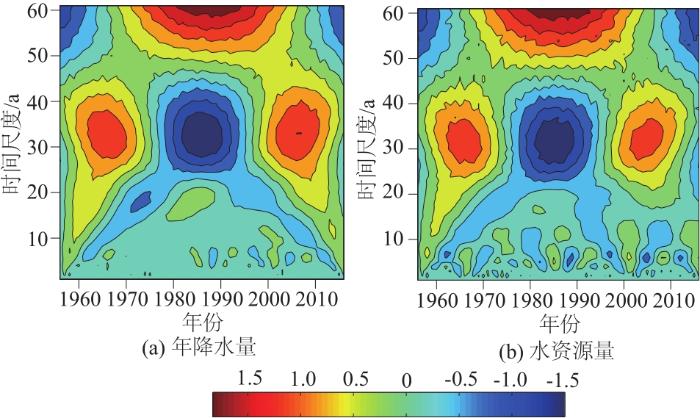
图7 澜沧江年降水量、水资源量小波系数等值线Fig.7 Wavelet coefficient contour map of annual precipitation and total water resources in Lancang River |
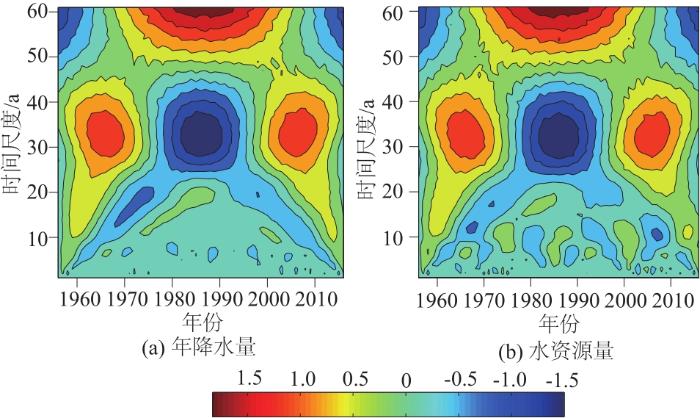
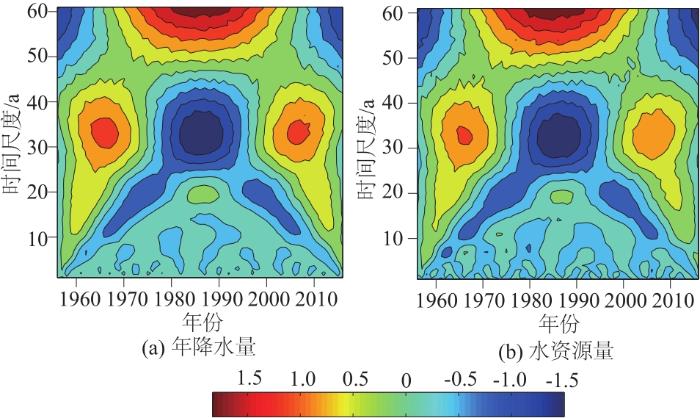
图8 怒江年降水量、水资源量小波系数等值线Fig.8 Wavelet coefficient contour map of annual precipitation and total water resources in Nu River |
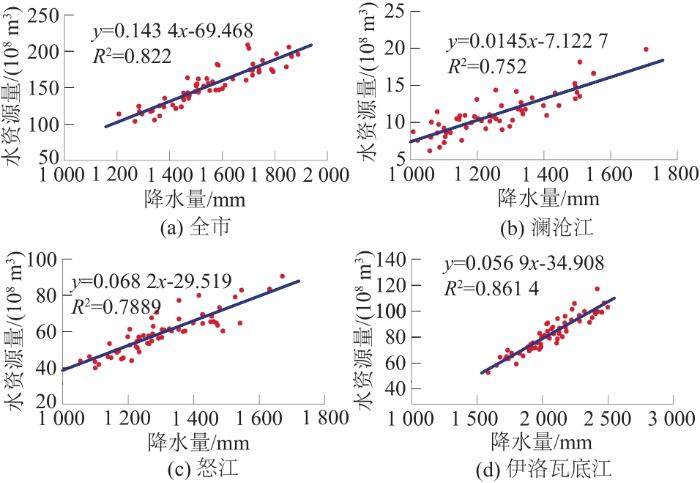
3.5 水资源量与降水量的关联分析
4 讨论
西南诸河(澜沧江、怒江、伊洛瓦底江)保山区域水资源的变化存在明显的趋势性、周期性和局部突变[24]。首先,尽管各水系的水资源量和年降水量存在一定波动,但整体上呈现下降趋势,尤其是在2000—2016年期间。M-K趋势分析结果显示,保山市的年降水量和水资源量均呈下降趋势(下降率分别为-0.507 mm/a和-0.301×108 m3/a),这表明未来几十年可能面临水资源不足的风险。其次,周期性分析显示,年降水量和水资源量在19、33 a尺度上表现出显著的周期性振荡,这预示未来几年可能出现较低的水资源供应。最后,水资源量与降水量之间呈正相关性,较高的R2表明降水量的变化直接影响水资源量,强调了降水变化对未来水资源管理的潜在影响。
此外,近年来关于气候变化对水资源的影响的研究普遍指出,水资源量的变化与气候因素密切相关,尤其是降水量和蒸发量的相互作用[29]。通过M-K趋势分析和突变分析确认了水资源变化的可能趋势,不同分析方法的综合应用可能提供更为全面的视角,进一步揭示隐藏的变化模式。
5 结论
对西南诸河三大水系及保山市1956—2016年年降水量和水资源量进行了长期变化特征分析,主要结论为:
(1)保山市水资源量总体呈下降趋势,澜沧江、怒江和伊洛瓦底江水系的水资源量年均变化率分别为-0.024×10⁸、-0.100×10⁸、-0.175×10⁸ m3/a。
(2)年降水量与水资源量均在33 a尺度上存在显著的周期性振荡(主周期约为24 a)。2016年处于低频末期,基于小波相位的统计外推预测未来降水量和水资源量偏少的趋势。
(3)不同水系的水文学特征存在一定差异。澜沧江、怒江水资源量除24 a的主周期外,还在7、12 a尺度存在主周期约为9 a的振荡。
(4)怒江、伊洛瓦底江和保山市的降水量与水资源量周期性一致,表明水资源量对降水变化敏感,二者的决定系数R2在0.75以上。
本文研究的局限性在于未能充分考虑人类活动和社会经济因素对水循环的影响。尽管如此,本文揭示了气候变化对西南诸河保山地区水循环的潜在影响,对未来水资源规划和管理具有重要意义。未来研究应结合更多数据源,深入探讨气候变化和水文学特征之间的关系。