River Lake Protection and Regulation

A Copula-based Method for River Ecological Flow Quantification and Algal Bloom Risk Assessment in the Hanjiang River

  • NONG Xi-zhi , 1 ,
  • LAI Cheng 1 ,
  • JING Zheng 2 ,
  • YE Ye , 3
Expand
  • 1 School of Civil Engineering and Architecture,Guangxi University,Nanning 530000, China
  • 2 WaterEnvironment Department, Changjiang River Scientific Research Institute, Wuhan 430010, China
  • 3 Sino-Japan Friendship Center for Environmental Protection, Beijing 100029, China

Received date: 2023-11-21

  Revised date: 2024-03-08

  Online published: 2025-05-21

Abstract

[Objective] Riverine ecological flow quantification is essential for maintaining riverine ecological health. Traditional methods often overlook the joint risks of hydrological and ecological factors and tend to rely on single-scenario calculations. This study aims to establish a joint risk model based on Copula functions and Bayesian theory to quantify the interdependence between hydrological (flow) and ecological (algal density) factors in the middle and lower reaches of Hanjiang River, thereby achieving scientific quantification of ecological flow under multiple scenarios and providing a basis for early warning and regulation of algal bloom risks in rivers. [Methods] Using flow data from Xiantao station and algal density data from Yuekou cross-section during the 2018 algal bloom outbreak in Hanjiang River,this study first determined the marginal distributions of flow and algal density using the Kolmogorov-Smirnov (K-S) test and Akaike Information Criterion (AIC). The optimal Copula functions were then selected using maximum likelihood estimation and goodness-of-fit test. Finally, a joint distribution model of flow and algal density was established, and the Bayesian conditional probability formula was applied to analyze the probability of algal density exceeding the threshold of algal bloom occurrence under different flow scenarios. The results from Copula functions were compared with those from the Tennant method and Hydrological Inflection-Point (HIP) analysis for validation. [Results] (1) The joint distribution model based on Gaussian Copula function passed the K-S test and effectively captured the significant negative dependence structure between flow and algal density.(2) During the 2018 algal bloom outbreak in Hanjiang River, when the flow exceeded 728.00 m3/s and 1 096.30 m3/s, there was over an 80% probability that algal density would exceed 2 561.10×10⁴ cells/L and 902.93×10⁴ cells/L, respectively. (3) The hydrological inflection point method calculated the initial flow of algal bloom with an error within 100 m3/s, demonstrating higher accuracy than the Tennant method. However, both methods underestimated the overall risk due to their neglect of variable dependency. Through bivariate analysis, the Copula model revealed risk details that traditional methods failed to capture. [Conclusions] (1) The joint risk model based on Copula functions can quantitatively capture the complex dependency between hydrological and ecological factors, overcoming limitations of traditional methods that depend on long-term data and neglect multi-factor interactions. It provides an efficient tool for analyzing ecological flow during a single algal bloom outbreak.(2) The multi-scenario conditional probability analysis demonstrates that risk probabilities of algal density differed significantly across different flow ranges, offering refined flow thresholds for reservoir operations and bloom prevention.(3) In complex hydro-ecological systems, it is necessary to integrate multi-factor models like Copula to avoid risk underestimation. This study provides a new method for multi-factor joint risk evaluation and ecological flow quantification in rivers. Future research can further incorporate multiple variables such as water quality and temperature to establish more complex Copula models, improving prediction accuracy and scenario simulation capabilities.

Cite this article

NONG Xi-zhi , LAI Cheng , JING Zheng , YE Ye . A Copula-based Method for River Ecological Flow Quantification and Algal Bloom Risk Assessment in the Hanjiang River[J]. Journal of Changjiang River Scientific Research Institute, 2025 , 42(5) : 34 -42 . DOI: 10.11988/ckyyb.20231281

0 引言

随着经济发展和人口增长,河流在城市化、工业化及农业生产等过程中被改造以便实现水资源利用的最大化,但带来的经济增长通常伴随着对生态系统和生物多样性的破坏[1]。河流生态问题日益突出[2],其中正确估算和评价河流生态流量一直是生态环境研究中的热点和难点[3]
生态流量在不同国家和研究角度下有着不同的定义[4]。目前,生态流量最广泛的定义是:能够维持河道及河口的自然生态系统和人类生存发展所依赖的生态系统所需要的水量、时间和水质[5-6]。生态流量具有阈值[7],生态流量高于或低于阈值都会对生态系统造成破坏,因此对生态流量的定值依旧是全球关注的重大问题[8]。全球如今有超过200种生态流量的计算方法,可大体分为水文学、水力学、生境模拟法和整体分析法[9]。水文学法通过对水文要素取不同的百分比对生态流量等级进行划分,例如Tennant法[10]和7Q10法[11]。水文学法简单易行且不需要进行实际测量,具有定性的指导意义,也可作为其他方法的检验,因此Tennant法在国内外有着广泛的应用[12-13]。但是,水文学法没有考虑河道流量的动态变化,也没有从流域的特性和成因规律进行流量分析,存在较大任意性和地区适用性问题[14]
另一种重要的方法是水力学法,它通过建立概化断面和流量之间的相关关系计算生态流量的推荐值[14]。此方法测量简单,数据易得,与水文学法相比,它包含更多具体的河流信息,因此同样被广泛使用[15-16]。但是,水力学法仍存在忽略流速和季节的变化、选取断面无法代表整条河流等问题[14]。生境模拟法通过可利用的栖息地信息与河道流量的关系曲线求得特定数量物种最适宜的生态流量[17]。该法结果基于生物原则且可量化,是目前被认为最可信的评价方法[18]。但是,生境模拟法要求详细的数据资料支撑,在使用上限制较大,不易进行广泛应用[11]
大部分计算方法需要大量的数据进行生态流量推演及校核,经济和人力成本较高,因此它们难以推广应用。一些数学方法可为克服生态流量定值过程中的成本与准确性之间的矛盾提供有效的解决途径。拐点,指微分数学上改变曲线向上或向下方向的点,是曲线的凹凸分界点[19]。近些年来,拐点法被广泛应用于确定湖泊需水量、建立最大允许排放量模型和建立污染物与流量的关系[20-21]。在水质风险事件背景下,流量是制约水华发生的关键因子之一,当实际流量大于临界流量时,水环境改善,水华发生概率降低,反之则水华发生概率增高。其间,应存在某一临界流量,使得在大于该流量时水环境良好;而小于该流量时则水环境恶化。同时,流量相较临界流量越大,其对水环境的改善效果应越明显,反之亦然。此类流量影响水环境状态和水华发生概率的关系能够较好地通过拐点进行描述。拐点法的数学建模清晰,理论依据可靠,在研究生态单因素影响问题时能提供清晰的思路[22]。但是,确定可靠的生态流量不能忽视河流中水文和生态因子之间的复杂关系,Copula函数模型提供了一种定量描述这种关系的可能。近年来,Copula函数因不受边缘分布形式的限制,可完整保留变量间相关性信息,并可有效、自由地联合两个边缘分布不同的变量,再进行联合风险分析的特性,在水文领域的影响力日益广泛[23-24]。Copula函数结果基于数理统计的方法,具有坚实的理论依据,且计算成本低,拟合程度较高,为构造多联合分布提供了一种新思路[25-28]。然而,现在多数研究尚局限于河道水文、水质、水生物定量甚至定性描述方面,迄今缺少藻类水华与流量等水文要素定量关系的模型。
本研究将以世界第三长河流的最长支流汉江为例,对河流的生态流量定值和水华风险进行研究。本文目标为:①介绍水文因子和藻类生长的显著相关关系;②使用Copula函数和贝叶斯理论对河流生态流量定值进行综合研究;③对比评价不同类型的单因子、多因子方法得出的河流生态流量。本研究将为国内外的监管部门提供有效的河流生态流量定值方法、藻类控制策略的参考意见以及对相似河流进行联合风险管理的科学依据。

1 数据与方法

1.1 研究区域与数据采集

汉江全长1 577 km,流域面积15.9万 km2,发源于陕西秦岭南麓,流经陕西、湖北两省,最终由汉口龙王庙处汇入长江,落差1 964 m。汉江流域属于亚热带季风气候区,年均气温12 ~ 16 ℃,水面蒸发量700 ~ 1 100 mm,年均降雨量700~1 800 mm,降雨量年内分布不均且年际变化大。上游和中游年均降雨量750~900 mm,下游年均降雨量>1 100 mm,11—4月份为非汛期,5—10月份为汛期。本研究重点关注汉江水华频发的中下游断面,其中有5个主要的国家水文监测断面(如图1所示),分别为:黄家港站、襄阳站、皇庄站、沙洋站和仙桃站。此外,在研究期间,为实时监测藻密度而新建立6个省级水质应急断面,分别为:沙洋取水口、沙洋取水口下3~5 m、岳口、仙桃大桥、汉川和宗关。
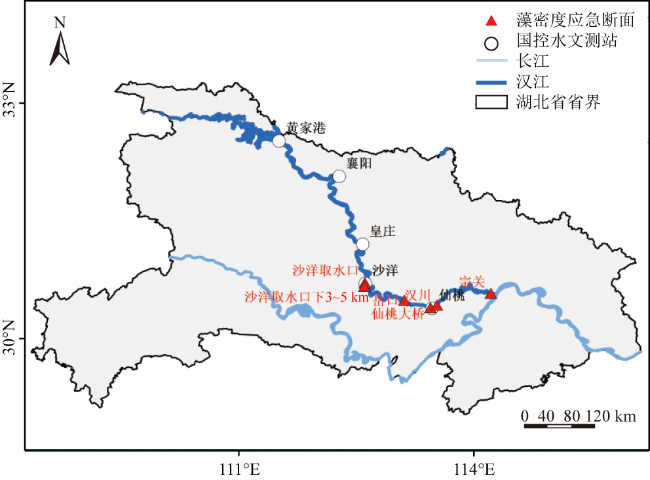
图1 2018年汉江水华暴发期间中下游水文与水质监测站点示意

Fig.1 Schematic diagram of hydrological and water quality monitoring stations in middle and lower reaches of Hanjiang River during 2018 algal bloom outbreak

2018年水华暴发期间,湖北省水文水资源局于2月13日至3月9日在水文测站和应急断面收集和监测地表水样本和流量的逐日数据,见表1表2。因为流量变化和藻类生长状态可以准确地反映人为活动和水库调度对流域产生的单一或联合效应,因此选取汉江下游重要水文控制断面仙桃站(113.28°E、30.23°N)的流量数据与距仙桃站较近且更能更早反映藻密度变化的岳口紧急断面(113.06°E、30.50°N)的藻密度数据作为本文的分析数据。
表1 汉江水文测站1975—2018年流量数据

Table 1 Flow data from hydrological stations(1975-2018)

水文测站 流量/(m3·s-1) 时期
黄家港 984.57±269.72 1975—2018年
628.88±91.29 2018年水华暴发期间
襄阳 1 168.76±408.92 1975—2009年
皇庄 1 020.32±158.95 2018年水华暴发期间
1 386.13±370.69 1975—2018年
沙洋 1 420.97±463.9 1975—2018年
仙桃 1 188.94±374.33 1975—2018年
927.6±128.12 2018年水华暴发期间
表2 应急断面在2018年水华暴发期间的藻密度数据

Table 2 Algal density data from emergency cross-sections during 2018 algal bloom outbreak in Hanjiang River

应急监测断面 藻密度/(104 cell·L-1)
沙洋取水口 1 263.34±746.48
沙洋取水口下3~5 km 1 274.46±763
岳口 1 621.93±876.34
仙桃大桥 1 840.91±979.64
汉川 1 965.87±942.33
宗关 2 219.15±984.44

1.2 方法

采用Copula函数对流量与藻密度进行分析,需要依靠采集的数据建立变量的边缘分布。本文首先选取水文研究中经典统计模型P-III型分布、正态分布、对数正态分布、伽马分布、指数分布等分布[29]进行拟合,同时应用K-S (Kolmogorov-Smirnov) 检验、平均偏差 (BIAS)、均方根误差(Root Mean Square Error,RMSE)、赤池信息准则(Akaike Information Criterion,AIC) 和离差平方和最小准则(Ordinary Least Squares,OLS) 进行检验和拟合优度评价。本文选取Gaussian Copula、t-Copula、Gumbel Copula、Clayton Copula、Frank Copula函数进行多情景下的双变量联合分布拟合试验,再经K-S检验和拟合优度评价确定最优Copula函数模型并求得联合风险概率,最后将分析结果与Tennant和水文拐点法结果进行对比,检验其准确性。具体步骤如下:
(1)确定边缘分布。常用的假设检验方法有 χ 2检验、t检验等参数检验和非参数K-S检验[30]
本文选取P-III分布、极值分布和Logistic分布拟合2018年水华期间仙桃站流量和岳口藻密度数据的实际分布 (视水华暴发期间流量与藻密度为整体,则流量与藻密度均为随机变量且对其采样均满足独立同分布),并采用K-S、Bias、RMSE、AIC和OLS优选边缘分布,优选原则为指标值越小则拟合度越高。K-S检验统计量以及各优选指标的计算公式详见文献[30-31]
(2)确定相关性结构。为确定联合分布函数,根据Gringorten公式计算水华期间藻密度与流量的联合经验频率H,计算公式为
H ( x i , y i ) = P ( X x i , Y y i ) = n i - 0.44 n + 0.12
式中: n i为联合观测样本中满足条件 x x i y y i的联合观测数据对数; n为样本容量; P ( · , · ) 为联合概率。
目前常用于度量水文变量相关性的指标有Pearson相关系数和Kendall秩相关系数[32]。相关也称积差相关,为两个变量之间的协方差和标准差的商,用来衡量定距变量间的线性关系。Kendall秩相关系数 τ定义为同序对和异序对之差与总对数 n ( n - 1 ) 2的比值,可用于描述变量之间线性与非线性的相关关系。Kendall秩相关公式详见文献[33],本文不再赘述。
(3)确定Copula函数。Copula函数可分为椭圆Copula和阿基米德Copula两大类[34]。阿基米德Copula按相依性特性分为对称型和非对称型。在水文领域,含一个参数的非对称型阿基米德Copula函数应用较多[35]
Copula函数的参数估计方法有极大似然法[36]、相关性指标法、非参数核密度估计[37]等,其中极大似然法中有3种方法可对Copula函数进行估计,分别为:全参数的极大似然法、分布的极大似然法和半参数的极大似然法。本文选用半参数的极大似然法对Copula参数进行估计,似然函数表达式为
L ( θ ) = i = 1 T l n c ( F X 1 ( x 1 (t) ) , , F X n ( x n (t) ) , θ )
式中: L ( θ ) 为对数极大似然函数; θ 为待定系数; F X 1 ( x 1 t ),…, F X n ( x n (t) ) t时刻下各随机变量的边缘分布函数; c ( · )为Copula概率密度函数。
常用的非对称阿基米德Copula以及相关性系数与参数的表达式详见相关文献[38]。
(4)确定Copula函数的条件分布。水华期间流量因子以变量X表示,藻密度以变量Y表示,根据Sklar定理[39]与Copula函数理论,可以得到XY的联合分布 H ( X , Y )和Copula的函数表达式。
得到表达式后,讨论变量y与给定Y之间的关系,得到Copula的条件分布,即可对联合的因子进行联合风险分析。二维Copula函数的条件分布如下:
在给定 Y = y时,X的条件分布函数为
H ( x | Y = y ) = P ( X x | Y y ) = H ( x , y ) y
在给定 Y > y时,X的条件分布函数为
H ( x | Y > y ) = P ( X x | Y > y ) = P ( Y > y , X x ) P ( Y > y ) = H X (x) - H ( x , y ) 1 - H Y ( y )
在给定 Y y时,X的条件分布函数为
H ( x | Y y ) = P ( X x | Y y ) = P ( Y y , X x ) P ( Y y ) = 1 - H Y ( y ) - H X (x) + H ( x , y ) 1 - H Y ( y )
式中: H ( · , · ) 代表联合分布函数; H ( A | B ) 代表满足 B 条件时,A 的条件分布函数; H · ( · ) 代表 · 的边缘分布函数; P ( · | · ) 为条件概率。

2 结果

2.1 流量与藻密度边缘分布拟合

表3可知,P-III分布、极值分布和Logistics分布均通过K-S检验和3种不同的拟合检验,但极值分布曲线和Logistic分布曲线可满足对流量与藻密度的拟合,因此分别选取极值分布和Logistic分布作为流量与藻密度的边缘概率分布。运用极大似然法来估计边缘分布的参数,得到藻密度的特征参数为 μ Y = 1640.59 , σ Y = 506.05,流量的特征参数为 k Q = - 0.11 , μ Q = 109.31 , σ Q = 847.14。因此得到流量(X) 和藻密度(Y)的边缘分布表达式为:
f ( X | k , μ , σ ) = 1 847.14 e x p - 1 + k x - 109.31 847.14 - 1 k   ,
f ( Y | μ , σ ) = e x p y - 1640.59 506.05 506.05 1 + e x p y - 1640.59 506.05 2
式中: k 为形状参数; μ 为位置参数; σ 为尺度参数。
表3 流量和藻密度最优分布曲线的选取

Table 3 Selection of optimal distribution curves for flow and algal density

变量 理论分布 K-S
检验
BIAS RMSE OLS AIC 最优
分布
流量 P-III分布 0.186 6 0.343 3 0.048 4 -145.51 极值
分布
极值分布 0.100 1 0.307 6 0.048 3 -145.38
Logistics分布 0.116 2 0.351 9 0.049 3 -146.47
藻密
P-III分布 0.349 1 0.103 8 0.065 7 -130.14 Logistics
分布
极值分布 0.192 9 0.417 7 0.048 2 -146.32
Logistics分布 0.124 5 0.389 5 0.049 3 -146.47

2.2 Copula模型构建

经计算Kendall秩相关系数为-0.88,可知流量与藻密度呈负相关,而所初选的5种Copula函数中仅有Gaussian Copula、t-Copula和Frank Copula可以描述负相关关系,因此运用K-S检验对3种Copula函数进行假设检验,取显著性水平为0.1,同时利用极大似然法估计Copula函数的参数 θ,并用拟合优度检验评价Copula函数,结果如表4所示。Gaussian Copula函数是最优Copula函数,因此应用Gaussian Copula函数来分析流量与藻密度的联合风险分布。
表4 不同类型的Copula函数的拟合优度检验

Table 4 Goodness-of-fit test results for different types of Copula functions

类型 拟合优度
RMSE AIC OLS
Gaussian 0.722 2 -165.774 8 0.034 9
t-Copula 0.723 8 -163.697 5 0.034 9
Frank 0.725 3 -165.768 6 0.034 9
已知藻密度与流量因子Kendall秩相关系数τ=-0.88,根据极大似然估计法得到ρ= 1 - 0.88 - 0.88 1,其中ρ是对角线上的元素全为1的2阶对称正定矩阵。 ø p 表示相关系数矩阵为ρ的二元标准正态分布的分布函数, ø - 1表示标准正态分布的分布函数的逆函数,基于前述分析得到流量Q与藻密度Y的联合分布函数 C ( Q , Y )图2所示。
C ( u , v ; ρ ) = φ p ( φ - 1 ( u ) , φ - 1 ( v ) )
图2 藻密度和流量的联合风险分布

Fig.2 Joint risk distribution of algal density and flow

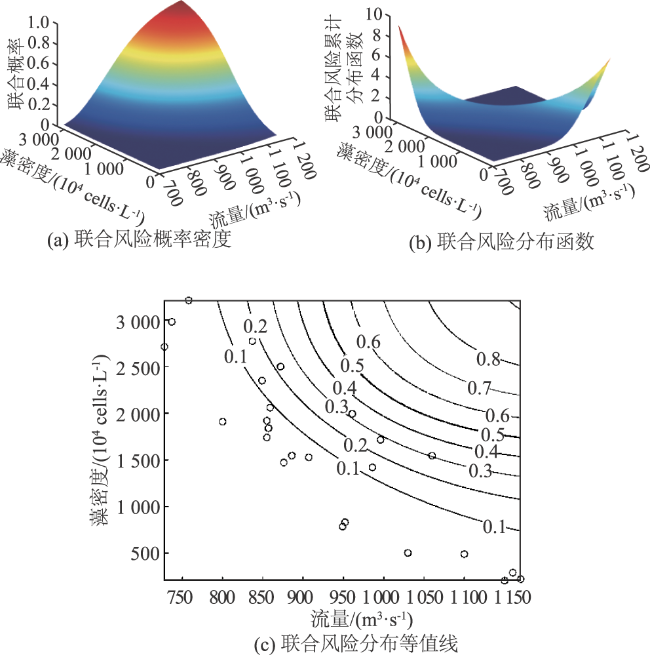
2.3 Copula条件概率的多情景分析

根据藻密度与流量的联合分布及边缘分布可推求任意藻密度与流量组合的联合概率。依据《湖北省水华监测技术指南(征求意见稿)》,当水华优势为单一硅藻优势时,鉴别水华发生的条件为藻密度>1 000×104 cell/L。将流量数据由最小到最大分为6个区间,由式(5) 可得到在不同流量时藻密度Y≥1 000×104 cell/L时的条件分布,进一步得到不同流量条件下Y>1 000×104 cells/L的条件频率曲线,见图3 P ( Y y | Q > q )表示在不同流量条件下藻密度的概率,表5列出了大于不同流量条件时藻密度的联合概率及对应的藻密度,其中1 096.3~1 170 m3/s为最大的流量区间,在Q>1 096.3 m3/s的流量条件下,藻密度分别有80%、60%、40%的概率达到902.93×104、1 239.40×10⁴、1 503.70×10⁴ cells/L;728~801.70 m3/s为最小的流量区间,在Q>728 m3/s的条件下,藻密度分别有80%、60%、40%的概率达到2 561.10×10⁴、2 849.50×10⁴、3 089.80×10⁴ cells/L。
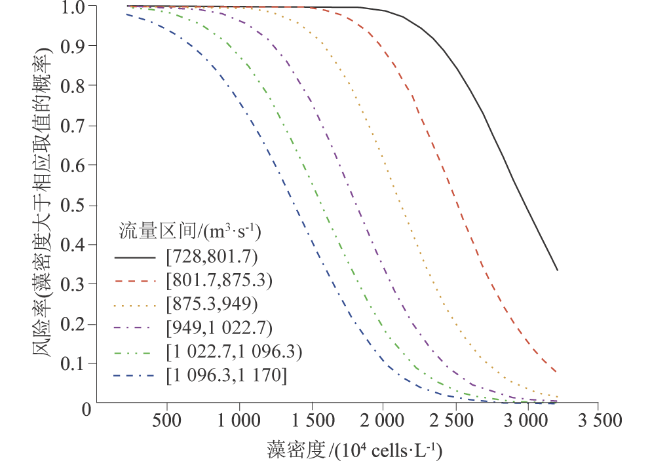
图3 藻密度在不同的流量区间的风险率

Fig.3 Conditional probability of algal density under different flow intervals

表5 藻密度在不同流量条件下的风险率

Table 5 Conditional probability of algal density under different flow rates

风险
率/
%
藻密度/(104 cells·L-1)
Q>
728.00
m3/s
Q>
801.70
m3/s
Q>
875.30
m3/s
Q>
949.00
m3/s
Q>
1 022.70
m3/s
Q>
1 096.30
m3/s
80 2 561.10 2 128.60 1 744.00 1 407.60 1 143.20 902.93
60 2 849.50 2 392.90 1 984.40 1 672.00 1 431.60 1 239.40
40 3 089.80 2 609.20 2 224.70 1 912.30 1 672.00 1 503.70

2.4 Copula函数与其他方法的对比分析

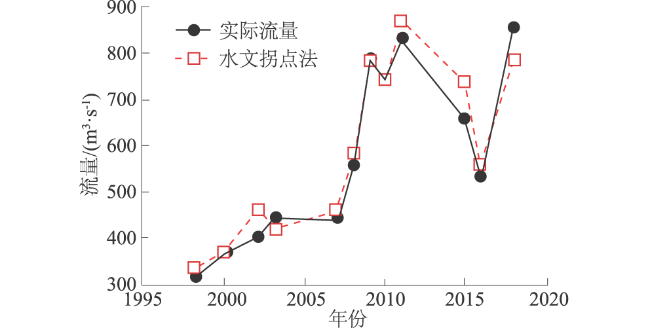
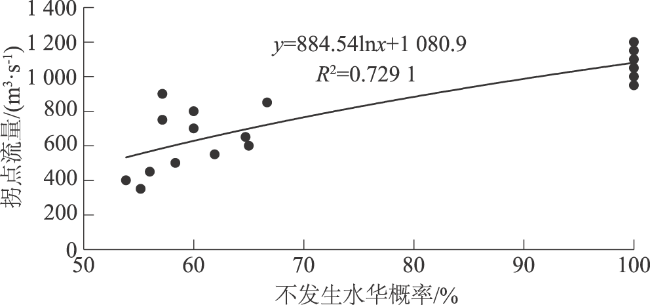
根据仙桃站1998—2018年1—3月(枯水期)的逐日流量数据,结合FITPE3配线程序,调整分布特征的偏态系数和离差系数得到仙桃站各年拟合良好的P-III型分布理论频率曲线。根据所求出的理论频率曲线 F (x) ,求其 F (x) 的解即为拐点流量。进而根据拐点法计算结果与水华发生时即藻密度开始大于107 cells/L的流量进行对比,结果见图4。1998—2018年水华开始与拐点流量对比的结果中,相差最大的一年是2004年,相差204 m3/s;相差最小为2000年,拐点流量等于水华开始流量,同时其他年份的结果相差均在100 m3/s以内,因此通过拐点法计算生态流量具有一定可靠性。
图4 水华发生时流量与拐点法计算流量的对比

Fig.4 Comparison between flow rate at algal bloom initiation and flow calculated using inflection-point method

通过计算,仙桃站拐点流量范围为315~870 m3/s,以50 m3/s为步长单位,统计在不同流量区间内发生水华的次数,计算水华发生的频率及不发生水华的频率,相关步骤详见相关文献[40],结果见图5。根据拟合关系,仙桃站在80%、60%、40%不发生水华的保证率下,拐点流量分别为883、629、270 m3/s。
图5 拐点流量与不发生水华概率的拟合关系

Fig.5 Fitting relationship between flow calculated using inflection-point method and probability of no algal bloom occurrence

从保持生态健康的角度上看待不发生水华的流量时,依据其他方法计算的结果可与Tennant法结果进行对比,Tennant法计算步骤详见相关文献[41]。根据Tennant法,当仙桃站流量大于721、480 m3/s时,栖息地状况评价分别为“最佳”和“极好”。

3 讨论

我国大部分河流的流量通常采用P-III进行拟合,效果良好[42-43],但在特定情况下也可以采用其他线型[44]。本文在边缘分布拟合时均通过了K-S检验及拟合优度评价筛选,其中,流量使用广义极值分布进行拟合。分析汉江自1992年起详细记录水华事件的历史资料可知,汉江水华多发生于冬末春初(1—3月份期间)的枯水期,尤以2月份最为集中,4月份记录的水华事件仅有1次(1998年)[45]。本研究采用的2018年监测数据是汉江有记录的水华事件中持续时间最长的一次,虽然水华暴发期同步监测的流量样本不属于长序列样本,但仍具有统计学意义。梁媛媛等[46]对广东省1977—2014年的洪峰频率拟合显示Inverse Guassian和Log-Logistic分布为最优分布;Huang等[47] 对三峡水库1878—2015年的逐日数据用Copula函数进行拟合,获得防洪水库最优拟合分布函数为Wakeby分布。可见,构建Copula函数的样本容量较小,并非影响联合分布风险模型结果的唯一制约因素,Copula函数在较小的样本容量和不完全序列测站的拟合对比中依然表现了计算结论的一致性和有效性[48]
Tennant法计算结果的含义是通过流量所占多年平均径流量的百分比来评价栖息地的生态健康状态[49], 这含义与不发生水华的流量概念有一定出入,但由计算结果可以看出,Copula的计算结果或拐点法的结果,均属于“极好”、“最佳”的水平,因此可以将Tennant法的结果作为判断方法是否合理的标准之一[50]。由于Tennant法要求河流在地貌上和田纳特所研究的河流具有相似之处[51],即干旱半干旱地区,且流量变化不大[52],因此Tennant法运用于汉江时,Copula计算的结果相差较大。
将拐点法与Copula结果对比时,发现拐点法得到的流量在Copula计算结果里,联合风险概率远高于发生水华的概率,处于一种被低估的状态。而对于拐点法而言,忽略了其他因素只考虑流量这个单因子,而Copula考虑的是藻密度和流量双因子,并经过相关性检验,仙桃站的流量与藻密度存在显著的相依性,不考虑相依性的分析存在误差与风险[53],因而考虑双因子分析的计算结果大于仅考虑单因子分析的计算结果。
同时,值得注意的时,2018年水华较历年水华出现新变化:在较大流量下发生了水华。殷大聪等[40]通过历史资料分析得出,当仙桃站流量>800 m3/s,对应满足90%不发生水华保证率,但此次水华期间,仙桃站流量保持在800 m3/s以上,并且在丹江口水库持续大流量下泄冲刷30余天才逐渐消退,其中丹江口水库下泄流量在900 m3/s以上长达25 d。该大流量情况下发生水华是受到冠盘藻的影响[54],冠盘藻是此次优势藻群,喜好水体扰动大且具有一定流速的环境,因而基于2018年水华期间的大流量基础数据构建模型的结果较大。

4 结论

本文研究了汉江2018年水华暴发期间中下游测站的流量与藻密度数据,并运用Copula函数对逐日观测数据进行联合分析来实现对河流生态流量的定值及不发生水华的多情景风险评估。主要结论如下:
(1)构建了一种基于Gaussian Copula函数的水环境双因子联合风险模型,避免了传统生态流量计算方法中准确性与计算成本的矛盾和依赖长期水文资料的弊端,能够较好地通过单次水华资料,建立流量和藻密度的相关关系来进行不同保证率下的藻密度预测。
(2)先采用Logistic分布和广义极值分布构建藻密度和流量的联合Copula函数。所构建的联合Copula风险分析模型在2018年仙桃站水华暴发风险分析中,得到当仙桃站Q>1 096.3 m3/s时,藻密度分别有80%、60%、40%的概率达到902.93×104、1 239.4×10⁴、1 503.7×10⁴ cell/L;在Q>728 m3/s 的条件下,藻密度数分别有80%、60%、40%的概率达到2561.1×104、2 849.5×10⁴、3 089.8×10⁴ cell/L。
(3)通过对Copula函数、 Tennant法、水文拐点法和实际流量分析所得生态流量的比较分析,表明基于Copula函数构建的流量与藻密度的联合风险模型在计算不发生水华的流量问题上的合理性优于其余方法。
本文在生态流量的基础上,提出了Copula计算的新方法,预测准确性令人满意,同时理论依据详实,研究成本低,较为简单实用。在本文基础上,进一步研究可以引入更多指标在Copula函数进行联合,以及将其他方法与Copula结合,以提升预测精度和多情景模拟精度。
[1]
VÖRÖSMARTY C J, MCINTYRE P B, GESSNER M O, et al. Global Threats to Human Water Security and River Biodiversity[J]. Nature, 2010, 467(7315): 555-561.

[2]
PALMER M, RUHI A. Linkages between Flow Regime, Biota, and Ecosystem Processes: Implications for River Restoration[J]. Science, 2019, 365(6459): eaaw2087.

[3]
AGUILAR C, POLO M J. Assessing Minimum Environmental Flows in Nonpermanent Rivers: The Choice of Thresholds[J]. Environmental Modelling & Software, 2016, 79: 120-134.

[4]
OPERACZ A, WAŁEsGA A, CUPAK A, et al. The Comparison of Environmental Flow Assessment - the Barrier for Investment in Poland or River Protection?[J]. Journal of Cleaner Production, 2018, 193: 575-592.

[5]
ARTHINGTON A H, BHADURI A, BUNN S E, et al. The Brisbane Declaration and Global Action Agenda on Environmental Flows (2018)[J]. Frontiers in Environmental Science, 2018, 6: 45.

[6]
WU Z, LAI X, LI K. Water Quality Assessment of Rivers in Lake Chaohu Basin (China) Using Water Quality Index[J]. Ecological Indicators, 2021, 121: 107021.

[7]
徐志侠, 王浩, 董增川, 等. 河道与湖泊生态需水理论与实践[M]. 北京: 中国水利水电出版社, 2005.

(XU Zhi-xia, WANG Hao, DONG Zeng-chuan, et al. Theory and Practice of Ecological Water Demand for Rivers and Lakes[M]. Beijing: China Water & Power Press, 2005.) (in Chinese)

[8]
GOPAL B. A Conceptual Framework for Environmental Flows Assessment Based on Ecosystem Services and Their Economic Valuation[J]. Ecosystem Services, 2016, 21: 53-58.

[9]
KURIQI A, PINHEIRO A N, SORDO-WARD A, et al. Influence of Hydrologically Based Environmental Flow Methods on Flow Alteration and Energy Production in a Run-of-river Hydropower Plant[J]. Journal of Cleaner Production, 2019, 232: 1028-1042.

[10]
TENNANT D L. Instream Flow Regimens for Fish,Wildlife,Recreation and Related Environmental Resources[J]. Fisheries, 1976, 1(4):6-10.

[11]
WEI X, DONG Z, HAO Z, et al. Ecological Flow Regime and Its Satisfactory DegreeAssessment Based on an Integrated Method[J]. Polish Journal of Environmental Studies, 2019, 28(5): 3959-3970.

[12]
ZOLFAGHARPOUR F, SAGHAFIAN B, DELAVAR M. Adapting Reservoir Operation Rules to Hydrological Drought State and Environmental Flow Requirements[J]. Journal of Hydrology, 2021, 600: 126581.

[13]
JIA W, DONG Z, DUAN C, et al. Ecological Reservoir Operation Based on DFM and Improved PA-DDS Algorithm: A Case Study in Jinsha River, China[J]. Human and Ecological Risk Assessment, 2020, 26(7): 1723-1741.

[14]
HAO Z, RALLINGS A M, ESPINOZA V, et al. Flowing from East to West: A Bibliometric Analysis of Recent Advances in Environmental Flow Science in China[J]. Ecological Indicators, 2021, 125: 107358.

[15]
BERTHOT L, ST-HILAIRE A, CAISSIE D, et al. The Use of Wetted Perimeter as Habitat Proxy to Assess Environmental Flows in Southern Quebec Rivers(Canada)[J]. Ecological Indicators, 2021,132:108283.

[16]
ZHAO C S, YANG Y, YANG S T, et al. Effects of Spatial Variation in Water Quality and Hydrological Factors on Environmental Flows[J]. Science of the Total Environment, 2020, 728: 138695.

[17]
ARMOUR C L, TAYLOR J G. Evaluation of the Instream Flow Incremental Methodology by U.S. Fish and Wildlife Service Field Users[J]. Fisheries, 1991, 16(5): 36-43.

[18]
THARME R E. AGlobal Perspective on Environmental Flow Assessment: Emerging Trends in the Development and Application of Environmental Flow Methodologies for Rivers[J]. River Research and Applications, 2003, 19(5/6): 397-441.

[19]
BANNER A. Thecalculus Lifesaver: All the Tools You Need to Excel at Calculus[M]. Princeton, N. J.: Princeton University Press, 2007.

[20]
崔宝山, 赵翔, 杨志峰, 等. 基于生态水文学原理的湖泊最小生态需水量计算[J]. 生态学报, 2005(7): 1788-95.

(CUI Bao-shan, ZHAO Xiang, YANG Zhi-feng, et al. Eco-hydrology-based Calculation of the Minimum Ecological Water Requirement[J]. Acta Ecological Sinica, 2005(7): 1788-1795.) (in Chinese)

[21]
杨志峰, 崔宝山, 刘静玲, 等. 生态环境需水量理论、方法与实践[M]. 北京: 科学出版社, 2003.

(YANG Zhi-feng, CUI Bao-shan, LIU Jing-ling, et al.Theory, Method and Practice of Eco-environmental Water Demand[M]. Beijing: Science Press, 2003.) (in Chinese)

[22]
陶洁, 李行, 左其亭, 等. 湖泊生态需水计算方法比较及实例应用[J]. 南水北调与水利科技, 2022, 20(2):365-374.

(TAO Jie, LI Xing, ZUO Qi-ting, et al. Comparison and Application of Calculation Methods for Ecological Water Demand of Lakes[J]. South-to-North Water Transfers and Water Science & Technology, 2022, 20(2): 365-374.) (in Chinese)

[23]
NELSEN R B. An Introduction to Copulas[M]. New York: Springer New York, 1999.

[24]
BHATTI M I, DO H Q. Recent Development in Copula and Its Applications to the Energy, Forestry and Environmental Sciences[J]. International Journal of Hydrogen Energy, 2019, 44(36): 19453-19473.

[25]
QIAN L, WANG X, WANG Z. Modeling the Dependence Pattern between Two Precipitation Variables Using a Coupled Copula[J]. Environmental Earth Sciences, 2020, 79(21): 486.

[26]
DEHGHANI M, ZARGAR M, RIAHI-MADVAR H, et al. A Novel Approach for Longitudinal Dispersion Coefficient Estimation via Tri-variate Archimedean Copulas[J]. Journal of Hydrology, 2020, 584: 124662.

[27]
XU P, WANG D, SINGH V P, et al. Copula-based Seasonal Rainfall Simulation Considering Nonstationarity[J]. Journal of Hydrology, 2020, 590: 125439.

[28]
LIU Y, WANG J, CAO S, et al. Copula-based Framework for Integrated Evaluation of Water Quality and Quantity: A Case Study of Yihe River, China[J]. Science of the Total Environment, 2022, 804: 150075.

[29]
LATIF S, MUSTAFA F. Copula-based Multivariate Flood Probability Construction: a Review[J]. Arabian Journal of Geosciences, 2020, 13(3): 132.

[30]
FREUND J E, MILLER M, JOHN E. Freund’s Mathematical Statistics with Applications[M]. London, United Kingdom: Prentice Hall, 2013.

[31]
WEN Y, YANG A, KONG X, et al. A Bayesian-model-averaging Copula Method for Bivariate Hydrologic Correlation Analysis[J]. Frontiers in Environmental Science, 2022, 9: 744462.

[32]
ZHANG R, CHEN X, CHENG Q, et al. Joint Probability of Precipitation and Reservoir Storage for Drought Estimation in the Headwater Basin of the Huaihe River,China[J]. Stochastic Environmental Research and Risk Assessment, 2016, 30(6):1641-1657.

[33]
DUPUIS D J. Using Copulas in Hydrology: Benefits, Cautions, and Issues[J]. Journal of Hydrologic Engineering, 2007, 12(4): 381-393.

[34]
SALVADORI G, DE MICHELE C, KOTTEGODA N T, et al. Extremes in Nature: An Approach Using Copulas[M]. Dordrecht: Springer Netherlands, 2007.

[35]
MING X, LIANG Q, DAWSON R, et al. A Quantitative Multi-hazard Risk Assessment Framework for Compound Flooding Considering Hazard Inter-dependencies and Interactions[J]. Journal of Hydrology, 2022, 607: 127477.

[36]
GENEST C, RÉMILLARD B, BEAUDOIN D. Goodness-of-fit Tests for Copulas:A Review and a Power Study[J]. Insurance: Mathematics and Economics, 2009, 44(2): 199-213.

[37]
SHEMYAKIN A, KNIAZEV A. Introduction to Bayesian Estimation and Copula Models of Dependence[M]. Hoboken, New Jersey: Wiley, 2017.

[38]
REDDY M J, GANGULI P. Bivariate Flood Frequency Analysis of Upper Godavari River Flows Using Archimedean Copulas[J]. Water Resources Management, 2012, 26(14): 3995-4018.

[39]
LIU Z, GUO S, XIONG L, et al. Hydrological Uncertainty Processor Based on a Copula Function[J]. Hydrological Sciences Journal, 2018, 63(1): 74-86.

[40]
殷大聪, 尹正杰, 杨春花, 等. 控制汉江中下游春季硅藻水华的关键水文阈值及调度策略[J]. 中国水利, 2017(9): 31-34.

(YIN Da-cong, YIN Zheng-jie, YANG Chun-hua, et al. Key Hydrological Thresholds Related to Algae Bloom in Middle and Lower Reaches of Hanjiang River and Studies on Mitigation Measures[J]. China Water Resources, 2017(9): 31-34.) (in Chinese)

[41]
WANG X, HAO G, YANG Z, et al. Variation Analysis of Streamflow and Ecological Flow for the Twin Rivers of the Miyun Reservoir Basin in Northern China from 1963 to 2011[J]. Science of the Total Environment, 2015, 536: 739-749.

[42]
CHEN L, SINGH V P, GUO S, et al. Copula-based Method for Multisite Monthly and Daily Streamflow Simulation[J]. Journal of Hydrology, 2015, 528: 369-384.

[43]
WANG X, ZANG N, LIANG P, et al. Identifying Priority Management Intervals of Discharge and TN/TP Concentration with Copula Analysis for Miyun Reservoir Inflows, North China[J]. Science of the Total Environment, 2017, 609: 1258-1269.

[44]
XU P, WANG D, WANG Y, et al. Time-varying Copula and Average Annual Reliability-based Nonstationary Hazard Assessment of Extreme Rainfall Events[J]. Journal of Hydrology, 2021, 603: 126792.

[45]
李昱燃, 李欣悦, 林莉. 2018年汉江中下游水华现象的思考与建议[J]. 人民长江, 2020, 51(8): 62-66.

(LI Yu-ran, LI Xin-yue, LIN Li. Thoughts and Suggestions on Water Blooms Phenomenon in Middle and Lower Reaches of Hanjiang River in 2018[J]. Yangtze River, 2020, 51(8): 62-66.) (in Chinese)

[46]
梁媛媛, 孙鹏, 张强. 基于Copula函数的1977—2014年广东省年最大洪峰特征分析[J]. 水利水电技术(中英文), 2022, 53(2): 1-17.

(LIANG Yuan-yuan, SUN Peng, ZHANG Qiang. Copula Function-based Analysis on Characteristics of Annual Maximum Flood Peak in Guangdong Province from 1977 to 2014[J]. Water Resources and Hydropower Engineering, 2022, 53(2): 1-17.) (in Chinese)

[47]
HUANG K, YE L, CHEN L, et al. Risk Analysis of Flood Control Reservoir Operation Considering Multiple Uncertainties[J]. Journal of Hydrology, 2018, 565: 672-684.

[48]
马晓晓. 基于Copula函数的不完全降水序列频率计算方法研究[D]. 杨凌: 西北农林科技大学, 2017.

(MA Xiao-xiao. Study on Frequency Calculation Method of Incomplete Precipitation Series Based on Copula Function[D]. Yangling: Northwest A & F University, 2017.) (in Chinese)

[49]
ACREMAN M C, DUNBAR M J. DefiningEnvironmental River Flow Requirements:A Review[J]. Hydrology and Earth System Sciences, 2004, 8(5): 861-876.

[50]
NIKGHALB S, SHOKOOHI A, SINGH V P, et al. Ecological Regime Versus Minimum Environmental Flow: Comparison of Results for a River in a Semi Mediterranean Region[J]. Water Resources Management, 2016, 30(13): 4969-4984.

[51]
王西琴. 河流生态需水理论、方法与应用[M]. 北京: 中国水利水电出版社, 2007.

(WANG Xi-qin. River Environmental Water Requirements[M]. Beijing: China Water & Power Press, 2007.) (in Chinese)

[52]
郭利丹, 夏自强, 林虹, 等. 生态径流评价中的Tennant法应用[J]. 生态学报, 2009, 29(4): 1787-1792.

(GUO Li-dan, XIA Zi-qiang, LIN Hong, et al. Researches on Application of the Tennant Method in Ecological Flow Evaluention[J]. Acta Ecologica Sinica, 2009, 29(4): 1787-1792.) (in Chinese)

[53]
马川惠, 黄强, 郭爱军. 泾河流域水沙联合分布特征分析及其不确定性评估[J]. 水利学报, 2019, 50(2):273-282.

(MA Chuan-hui, HUANG Qiang, GUO Ai-jun. Characteristic Analysis and Uncertainty Assessment of Joint Distribution of Flow and Sand in Jinghe River Basin[J]. Journal of Hydraulic Engineering, 2019, 50(2): 273-282.) (in Chinese)

[54]
李建, 尹炜, 贾海燕, 等. 汉江中下游硅藻水华研究进展与展望[J]. 水生态学杂志, 2020, 41(5):136-144.

(LI Jian, YIN Wei, JIA Hai-yan, et al. Research Progress on Diatom Blooms in the Middle and Lower Hanjing River: Review and Advances[J]. Journal of Hydroecology, 2020, 41(5):136-144.) (in Chinese)

Outlines

/