

0 引言
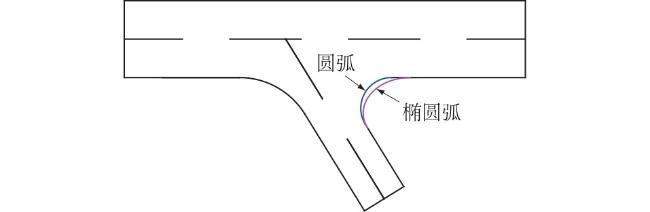
针对上述问题,本文采用数值模拟方法,结合物理模型试验,研究卜形岔管内部固液两相流动,探索了椭圆弧形倒角方案对岔管磨损特性和固液两相流动的影响,研究成果可为岔管设计提供参考。
1 研究方法
1.1 数值模拟
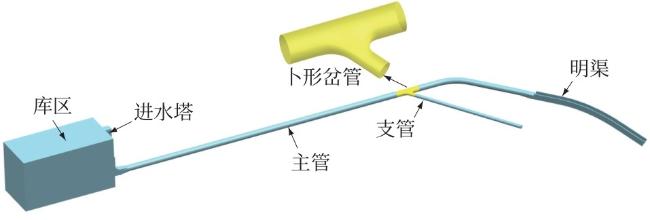
为准确模拟岔管内部固液两相流动,计算域除卜形岔管外,还包括部分库区、进水塔、主管、支管、末端明渠。对形状复杂的卜形岔管采用适应性更好的四面体网格进行离散,其他部分均采用六面体网格。为准确捕捉管道内部的流动细节,对卜形岔管曲率较大位置的网格进行局部加密,网格总数约125万。
连续方程为
动量方程为
式中: 为密度; 为时间;xi、xj为空间坐标(i=1,2,3,j=1,2,3); 分别为速度矢量在i方向、j方向的分量; 为质量力; 为压力; 分别为动力黏性系数、紊流黏性系数,μt=Cμρκ2/ε,Cμ=0.09,为经验常数, 为湍动能, 为湍流耗散率。
采用离散型冲击模型[35]求解颗粒对岔管的冲蚀磨损破坏,磨损模型为
式中:Rerosion为磨损率; 表示颗粒质量流量;Aface为管壁上网格的面积;?? 为颗粒质量流率,表示单位面积管壁受到磨损作用的颗粒质量;dp、α、v分别为颗粒作用在管壁的颗粒直径、冲击角度、冲击速度,相应地,C 、f 、b 分别表示颗粒直径函数、冲击角度函数、冲击速度函数。
运用Fluent 2021流体分析软件对两种体型岔管的水流运动和磨损特性进行模拟。采用有限体积法对控制方程进行离散,压力与速度耦合通过SIMPLEC算法求解,速度离散采用二阶迎风格式,湍流模型近壁采用标准壁函数处理。
由于主管单独运行时,管道引用流量大、水流流速高,易出现局部低压和高强度磨损分布,故本研究重点分析主管单独运行时岔管内部水力特性和磨损分布。库区进口根据库水位给定压力边界条件,库区顶部给定大气边界条件。明渠出口为自由出流、明渠顶部给定大气边界条件,末端分岔管支管出口断面设置为固壁边界。管道壁面设置为无滑移边界条件。泥沙颗粒直径为110 μm,颗粒质量流量为0.026 5 kg/s,颗粒初始速度为13.5 m/s。
1.2 模型验证
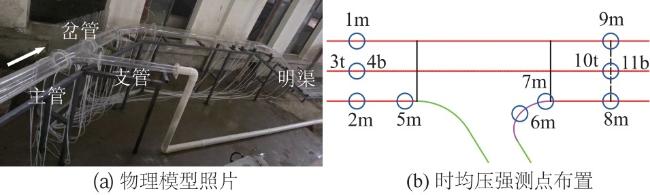
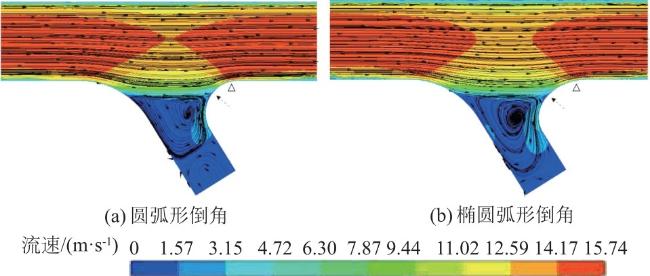
由岔管在清水条件下运行时内部流场数值模拟结果(图4)可知,水流在主管进口附近沿管轴线运动,在主、支管交汇处偏向支管一侧,在支管进口内部形成漩涡结构。图5为模型试验所监测的主管单独运行时岔管内部流场,粉红色为示踪剂,分别用小圆圈和黑色线框标注了红色示踪剂的流动范围。由图5(a)可知,在岔管上游的主管段内部,粉红色示踪剂沿主管轴线方向运动;当运动至主支管交汇处时,粉红色示踪剂略微偏向支管一侧;由图5(b)可知,支管进口附近出现的粉红色示踪剂区域与数值模拟计算得到的支管内部漩涡范围一致,说明支管内部形成了漩涡结构,示踪剂受漩涡卷吸作用而聚集在该区域。由此可知,模型试验得到的岔管内部流场特征与数值模拟结果基本一致。
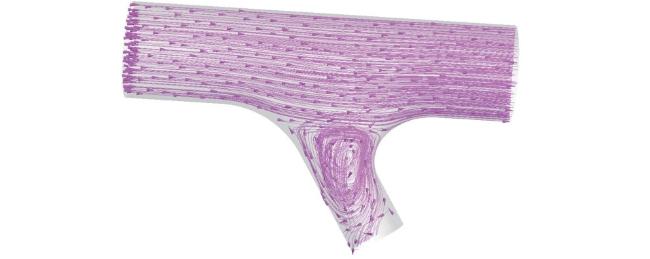
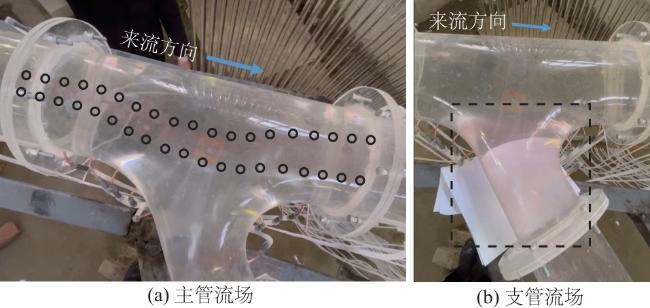
表1为岔管管壁测点时均压强的试验值与数值模拟值,可知,数值模拟值与试验值的边壁时均压强分布规律一致,二者误差范围为0.17%~3.15%。数值模拟结果与试验结果吻合良好,证明了数值模拟方法的可靠性。
表1 时均压强的试验值与模拟值对比Table 1 Comparison between experimental and simulated values of time-averaged pressure |
| 测点编号 | 时均压强/(9.81 kPa) | 相对误差/% | ||
|---|---|---|---|---|
| 试验值 | 模拟值 | |||
| 1m | 9.26 | 8.99 | 2.94 | |
| 2m | 8.88 | 8.92 | 0.48 | |
| 3t | 6.76 | 6.55 | 3.15 | |
| 4b | 11.58 | 11.38 | 1.77 | |
| 5m | 8.19 | 8.22 | 0.35 | |
| 6m | 13.96 | 14.09 | 0.94 | |
| 7m | 5.02 | 5.03 | 0.17 | |
| 8m | 8.23 | 8.28 | 0.57 | |
| 9m | 8.33 | 8.43 | 1.15 | |
| 10t | 10.94 | 10.83 | 1.03 | |
| 11b | 6.02 | 5.97 | 0.88 | |
2 结果与讨论
由式(3)可知,岔管表面的磨损量与颗粒粒径、冲击速度、冲击角度及质量流率有关。本研究中颗粒粒径为等值粒径,重点对比分析颗粒作用于2种岔管表面的冲击速度、冲击角度和质量流率,如图7—图9所示。由图7可知,颗粒对2种岔管主管的冲击速度明显高于对支管的冲击速度,颗粒对主管的冲击速度集中在5.6~11.2 m/s区间,对支管的冲击速度<2.8 m/s;此外,颗粒对2种岔管下游裆部靠主管附近区域均产生高速冲击(冲击速度>9.8 m/s),且颗粒对圆弧形倒角岔管裆部的冲击速度要明显高于椭圆弧形倒角岔管。就冲击角度而言,颗粒对2种岔管表面的冲击角度分布规律比较一致,较高冲击角度均出现在岔管下游裆部靠近支管一侧的区域(图8)。对比颗粒对2种岔管表面作用的质量流率(图9),可知,冲击圆弧形倒角岔管主管的单位面积的颗粒质量普遍>0.75 kg,而冲击椭圆弧形倒角岔管主管单位面积的颗粒质量普遍<0.60 kg,可知圆弧形倒角岔管遭受更高频率的颗粒冲击作用,说明椭圆弧形倒角能有效减轻颗粒与岔管表面发生碰撞的频率。
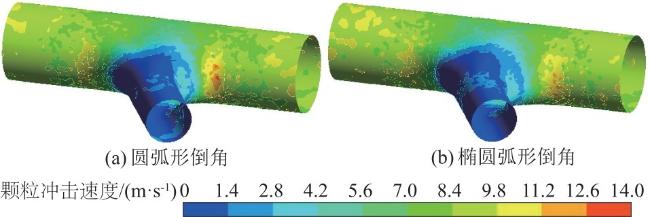
图7 颗粒对2种体型岔管管壁的冲击速度分布云图Fig.7 Contours of particle impact velocity on pipe walls of two bifurcated pipe types |
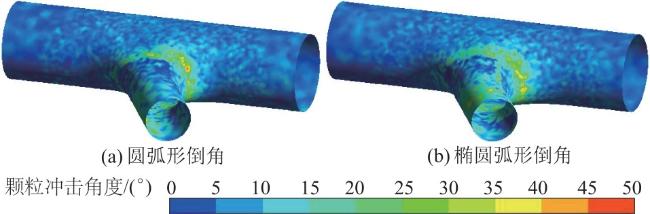
图8 颗粒对2种体型岔管管壁的冲击角度分布云图Fig.8 Contours of particle impact angle on pipe walls of two bifurcated pipe types |
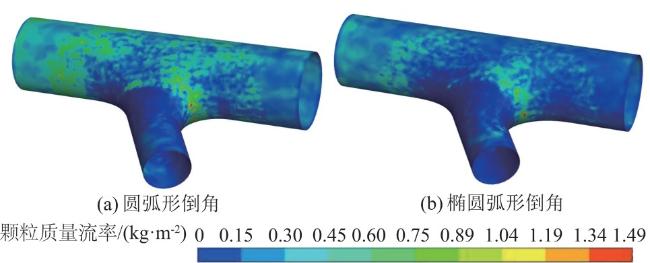
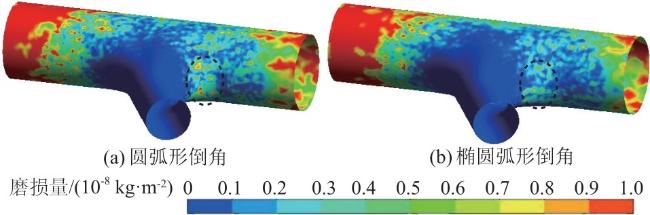
综合分析颗粒作用于2种岔管表面的冲击速度、冲击角度及质量流率,并与2种岔管表面的磨损分布进行对照,探究影响岔管磨损分布的关键因素。可知,岔管表面的磨损分布主要与颗粒冲击速度和质量流率相关,且后者对磨损分布的影响更大。颗粒作用于2种岔管进口和出口位置的冲击速度较大、质量流率较高,对应的磨损量也较高;颗粒对岔管下游裆部靠近主管侧的冲击速度虽然较高,但由于该位置受到颗粒冲击的质量流率较低,故磨损量较小;而颗粒对岔管下游裆部靠近支管侧的冲击速度虽然较低,但由于该位置受到较高频率的颗粒冲击作用,故磨损量较高。
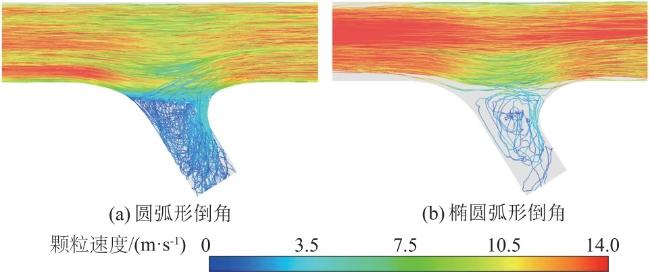
对2种岔管内部的540个随机颗粒轨迹进行分析,如图11所示。
2种岔管内部颗粒跟随水流运动,均在主、支管衔接处,受到支管漩涡卷吸作用而跟随漩涡做旋转运动。区别在于,在圆弧形倒角岔管内部,更多颗粒被卷吸至支管内部,且位于主管内的颗粒运动轨迹更加靠近管壁附近。而椭圆弧倒角岔管因支管内的漩涡对主管内部的水流运动顶托作用增强,主管内部的主流主要沿主管轴线方向运动,使得颗粒能够更加顺畅地离开岔管,具体表现为:颗粒主要跟随主管内的主流运动、仅少量颗粒被卷吸至支管内部,且跟随主流运动的颗粒轨迹主要集中在管道中心区域而离管壁较远,故较少颗粒与管壁发生碰撞,从而降低了颗粒作用于壁面的质量流率。
3 结论
本文采用数值模拟方法,结合物理模型试验,对岔管固液两相流动进行了研究,分析了影响磨损特性的关键因素,并探索了椭圆弧形倒角形状对岔管磨损分布的影响机制。研究结论如下:
(1)岔管磨损严重的位置集中在主管段进口、出口,岔管裆部次之,支管磨损较轻。
(2)岔管表面的磨损分布主要与颗粒冲击速度和质量流率相关,且后者对磨损分布的影响更大。
(3)与圆弧形倒角相比,椭圆弧形倒角岔管因水流运动顺畅,利于颗粒输送,从而降低了颗粒作用于管壁的质量流率,可有效减轻磨损。
(4)本研究成果可为类似工程的岔管设计提供参考,发挥指导和借鉴作用。