

0 引言
三峡电站是我国装机容量最大的水电站,在其进行短期调度计划制作、经济运行计算时,最大最小水位约束是需要考虑的主要约束之一。目前工程中,依据发电计划编制计算未来水位常用水动力学方法或水量平衡方法,以某一时段为步长进行多次迭代计算。该方法缺陷在于误差累积,时段越长误差积效果越显著,从而逐渐失去参考价值,尤其对于如三峡的超大型水库,微小的预测误差会造成极大的水量误差。传统的水动力学方法或水量平衡方法已无法满足其精细化调度需求,因此,急需一种可以高效精确预测未来数日最大最小水位的方法来为三峡电站短期运行计划制作提供技术支持。
对于使用计算机算法处理水位预测问题,许多学者展开了相关研究,纪国良等[1]采用循环神经网络(Recurrent Neural Network, RNN)模型,替换水动力学模型,对长寿水文站的站点未来水位进行预测,取得了绝对误差≤0.4 m的预测成果,是循环神经网络方法应用的良好示例;唐鸣等[2]将三层长短时记忆网络模型(Long-Short Term Memory Model, LSTM)应用于南水北调中线京石段水位预测,取得了比深度神经网络(Deep Nature Network, DNN)和RNN模型更加精确的预测结果,展示了LSTM算法在时间序列问题处理上的优势;徐杨等[3]使用LSTM算法,考虑了三峡动库容、调峰及入库流量计算密度不够等方面的影响,在复杂情况下,达到了较高精度的水位预测;刘晓阳等[4]借助人工神经网络、支持向量机、随机森林3种不同的方法,对三峡水库坝前水位进行小时尺度水位预测,发现随机森林模型在精度评价中表现最优;马飞等[5]提出一种融入改进注意力机制的长短期记忆网络预测模型,在LSTM前引入注意力机制对2个序列分别进行注意力计算,然后再融合,提高了LSTM对水位预测的精度。
综合上述研究,深度学习方法凭借其对多元数据关系的计算能力,以及LSTM算法对时间序列问题计算的优势,在水电领域得到广泛应用。未来数日水位极值作为水库调度约束条件重要一环,其精准预测对水电站经济运行研究有重要意义。因此,本文根据水位计算思路及影响因素选取特征变量,构建水量平衡迭代算法模型和改进LSTM预测模型,采用三峡水库2015—2021年运行数据,对三峡未来4 d最大最小水位做出了预测。通过对比,探究深度学习模型的预测能力,以及模型是否考虑三峡库区水面线、选取不同输出对模型预测结果的影响。
1 研究方法
1.1 最大最小水位预测框架
依据时段的出力规划,结合入库流量预报可进行对应时段间隔的连续水位计算,流程如图1所示。
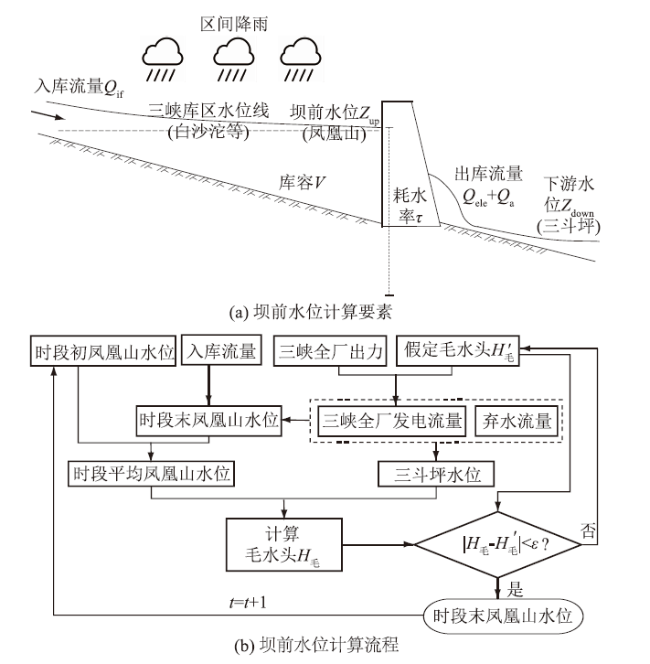
计算需要得到电站的未来出力规划和入库流量(Qif)预报。首先假定毛水头H'毛(m)与时段初的三峡上游水位数据,根据毛水头-耗水率曲线,计算得到假设耗水率 ,耗水率与时段规划出力N(万kW)相乘得到发电流量Qele(m3/s);同时,可以根据三峡的水位-库容曲线查询得到时段初的库容 ,结合水量平衡公式(式(1))计算得到时段末的库容Vt,Δt为时段长度,本文取2 h。
再根据水位库容曲线转换为时段末水位 。根据发电流量Qele查询出库流量-尾水位曲线,可得到时段末的三峡下游水位 ,此时时段初末上下游水位( 、 、 、 )皆已知,可以计算得到时段平均毛水头H毛(式(2))。
如果计算毛水头H毛和假定毛水头H'毛之差小于一定范围,则可进行下一时段计算,否则取假定毛水头和计算毛水头的平均值,作为新的假定毛水头,重新开始本时段的假定和计算。模型可计算得出未来4 d内每2 h/次的水位预测,取其中每日预测水位的最大最小值,即可作为未来4 d的最大最小水位。
构建深度学习计算模型时,需考虑到水位计算有显著的时间序列特性,入库流量、电站出力等存在影响时间滞后性,因此选用长短期记忆网络模型(LSTM)进行预测。LSTM能够有效减缓长序列问题中可能出现的梯度消失或爆炸, 在更长的序列问题上表现优于传统RNN模型。
输入数据划分为历史4 d和未来4 d两部分如表1所示,历史数据包括凤凰山、三斗坪历史水位(包括历史日最大最小水位)数据,出力数据,降雨和入库流量数据;未来数据主要为出力计划、降雨预报、入库流量预报。每个计算时刻点均可提取出历史与未来共8 d的时间序列三维数据,组成LSTM的训练数据集。LSTM直接以未来4 d的最大最小水位作为输出,共8个值组成一维序列。
表1 模型基础特征变量Table 1 Basic feature variables of the model |
| 数据类型 | 特征变量 |
|---|---|
| 历史数据 (4 d) | 三斗坪水位、凤凰山水位、三峡入库流量、寸滩-凤凰山区间降雨三峡、葛洲坝历史出力 |
| 未来预报数 据(4 d) | 三峡、葛洲坝出力计划、三峡入库流量预报、寸滩-凤凰山区间降雨预报 |
研究所使用的数据均取自三峡电站历史运行数据,所需的预报数据可从电站预报部门获取。
1.2 LSTM
LSTM是一种特殊的循环神经网络模型(RNN),输入数据必须为三维张量,3个维度分别为[samples, time steps, features],features为特征变量的数量,samples为训练数据组数,time steps为时间步长。LSTM的计算关键是细胞状态(cell state),Ct用来保存当前LSTM的状态信息并传递到下一时刻的LSTM中。当前的LSTM接收来自上一个时刻的细胞状态Ct-1,并与当前LSTM接收的信号输入xt共同作用产生当前LSTM的细胞状态Ct,解决了长序列训练过程中的梯度消失和梯度爆炸问题,因此其更适用于时间序列问题。这些操作通过模型中的遗忘门、记忆门和输出门,经过4个步骤来完成。模型示意图如图2所示。
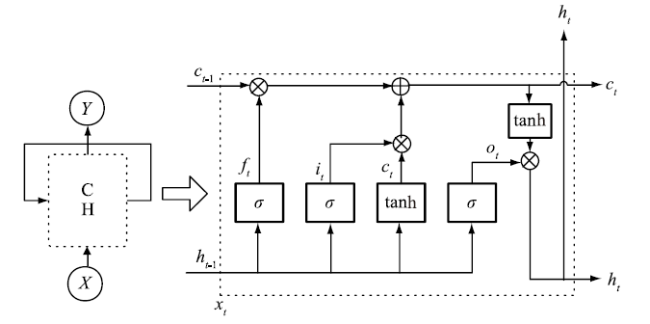
LSTM 通过遗忘门(forget gate) 和输入门(input gate)实现记忆单元信息状态的控制。遗忘门ft决定在t时刻要丢弃ht-1和Xt的哪些水位影响信息;输入门it用来确定在t 时刻需要将多少Xt和ht-1的水位影响信息传递到Ct,以便更新 Ct-1存储的信息。LSTM 用输出门(output gate)来控制单元状态 Ct,在当前t时刻,有多少ht-1和Xt中的水位影响信息要进行输出[6]。
1.3 模型构建
模型构建分为深度学习算法模型和水量平衡算法模型。深度学习模型采用均方误差(Mean Squared Error, MSE)作为损失函数,测试集计算结果则选用平均绝对误差(Mean Absolute Error, MAE)来评判优劣,计算式分别为:
式中:yi、 分別为实测值、模拟值;n为模拟序列长度。
MSE函数是二次函数,处处可导,随损失值减小梯度减小,有利于收敛,可提高模型训练效率。MAE则更为直观,可更好地观察模型训练后的预测误差。构建深度学习模型时需考虑参数优化方法、特征变量选取,以及如何提高训练稳定性。在参数优化方面,本模型根据多次计算经验,预设了不同参数组合,在epoch设置为5次的情况下,按照不同的预设参数组合,先进行小批次的全数据集训练,本文设置batch size为96或48,神经元数量为80、100、120或150,训练数据集采用了2015—2019年的三峡运行数据,得到损失值最低、降低最快的参数组合作为预测模型的参数。该方法取得的损失值降低改进如表2所示。
表2 模型参数优化前后训练损失值对比Table 2 Comparison of training loss values before and after model parameter optimization |
| 阶段 | 模型训练损失值降低过程/10-3 |
|---|---|
| 优化前 | 8.2➝4.0➝0.16➝0.84➝0.53➝0.43 |
| 优化后 | 5.5➝1.6➝0.36➝0.27➝0.19➝0.17 |
深度学习模型在训练过程中,当达到一定批次和拟合精度以后,损失值将呈现波动而非连续下降,无法保证终止训练即可得到最优训练结果。因此,为了提高模型训练结果的稳定性,本文构建模型时为其添加了ModelCheckpoint函数。此程序函数用于存储深度学习训练得到的损失值的训练结果,在进行模型导出时,可以输出训练过程中拟合效果最佳、损失函数最小的模型,避免模型训练时损失值波动导致输出结果不稳定。
此外,根据选取特征变量的差异,本文构建了2种深度学习模型,其特征如表3所示。
表3 模型特征说明Table 3 Description of model features |
| 模型名称 | 模型特征 |
|---|---|
| LSTM_Model1 | 特征变量不考虑三峡库区水面线 |
| LSTM_Model2 | 特征变量考虑三峡库区水面线,即白沙沱、石宝寨、万县、云阳奉节、巴东、巫山、秭归的水位数据 |
LSTM_Model1与LSTM_Model2的区别在于特征变量是否考虑了三峡库区水面线。因为三峡水库范围广阔,坝前水位预测常受到动库容影响,且对入库流量响应存在滞时,库区水面线能一定程度反映水库楔蓄情况,因此构建上述2个模型并进行预测效果对比,分析特征变量考虑库区水面线对预测精度的影响。
2 预测结果分析
使用水量平衡模型和深度学习模型分别对2020年三峡库区未来4 d最大最小水位进行预测计算。
2.1 水量平衡迭代方法与深度学习模型对比分析
表4 水量平衡算法模型和LSTM_Model2计算三峡库区未来4 d最大最小水位平均绝对误差Table 4 Mean absolute errors of maximum and mini-mum water levels for the next four days calculated by the water balance model and LSTM_Model2 |
| 方法 | 时间 | MAE/cm | 方法 | 时间 | MAE/cm | ||
|---|---|---|---|---|---|---|---|
| 最大 水位 | 最小 水位 | 最大 水位 | 最小 水位 | ||||
| 水量 平衡 算法 | 第1日 | 13.4 | 9.5 | LSTM_Model2 | 第1日 | 6.3 | 6.2 |
| 第2日 | 22.8 | 19.2 | 第2日 | 7.3 | 7.1 | ||
| 第3日 | 31.7 | 28.1 | 第3日 | 8.0 | 7.8 | ||
| 第4日 | 40.4 | 36.9 | 第4日 | 9.0 | 8.4 | ||
表5 模型计算未来4 d最大最小水位R2Table 5 R2 of maximum and minimum water levels for the next four days calculated by different models |
| 方法 | 时间 | R2 | 方法 | 时间 | R2 | ||
|---|---|---|---|---|---|---|---|
| 最大 水位 | 最小 水位 | 最大 水位 | 最小 水位 | ||||
| 水量 平衡 算法 | 第1日 | 0.998 | 0.999 | LSTM_Model2 | 第1日 | 0.999 | 0.999 |
| 第2日 | 0.995 | 0.998 | 第2日 | 0.999 | 0.999 | ||
| 第3日 | 0.991 | 0.994 | 第3日 | 0.999 | 0.999 | ||
| 第4日 | 0.984 | 0.989 | 第4日 | 0.999 | 0.999 | ||
2.2 LSTM_Model1与LSTM_Model2对比
LSTM_Model1与LSTM_Model2两模型的区别在于LSTM_Model1的特征变量未考虑三峡库区水位线,LSTM_Model2特征变量则加入了三峡库区水位线。三峡库区的水位预测长期受到动库容因素影响,而动库容问题与三峡楔蓄情况相关联,因此构建上述两模型进行对比,观察深度学习算法能否在考虑三峡库区水位线后对最大最小水位做出更为精确的预测。两模型计算未来4 d最大最小水位误差对比如表6所示。
表6 LSTM_Model1与LSTM_Model2 MAE对比Table 6 Comparison of MAE between LSTM_Model1 and LSTM_Model2 |
| 方法 | 时间 | MAE/cm | 方法 | 时间 | MAE/cm | ||
|---|---|---|---|---|---|---|---|
| 最大 水位 | 最小 水位 | 最大 水位 | 最小 水位 | ||||
| 水量 平衡法 | 第1日 | 6.81 | 7.52 | LSTM_Model2 | 第1日 | 6.3 | 6.2 |
| 第2日 | 8.54 | 8.40 | 第2日 | 7.3 | 7.1 | ||
| 第3日 | 7.68 | 7.84 | 第3日 | 8.0 | 7.8 | ||
| 第4日 | 9.28 | 8.42 | 第4日 | 9.0 | 8.4 | ||
从MAE统计分析可以看出,不考虑三峡库区水位线的LSTM_Model1模型预测效果较为不稳定,但总体上,2个模型的预测误差较为接近,LSTM_Model2略微优于LSTM_Model1。在预测的第1日和第2日,LSTM_Model1的预测平均绝对误差比LSTM_Model2高出1 cm以上,第3日和第4日两模型的预报效误差则相差不超过0.4 cm。这表明,将库区水面线作为应对动库容问题的策略添加至模型中,有利于提高模型的预测稳定性,尤其提高2 d内预测精度。
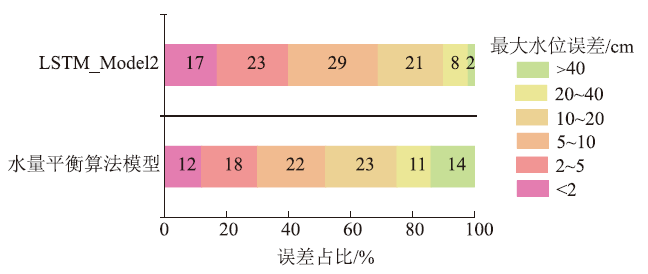
总体分析可知,2种模型的预测效果都比较稳定,绝对误差达到50 cm以上的情况仅有0.95%,误差分布也较为接近,针对三峡水位计算的动库容问题,使用深度学习算法时增加库区水面线作为特征变量,可降低三峡最大最小水位的预测误差10%左右,有利于提高模型预测稳定性。
2.3 误差分布情况
2020年1—12月LSTM_Model2预测第4日最大水位绝对误差年内分布如图4所示。
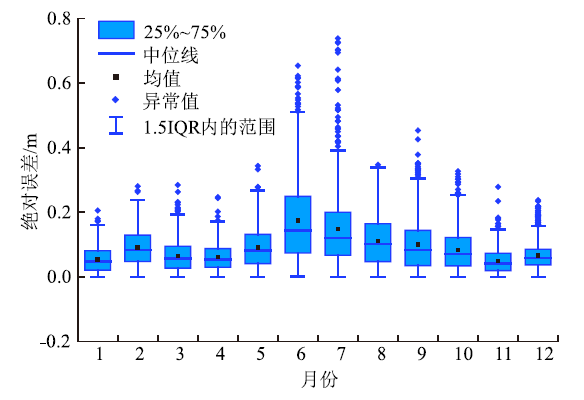
表7 LSTM_Model2各时期计算误差对比Table 7 Calculation errors of LSTM_Model2 in different periods |
| 时期 | MAE/cm | MAXE | 时期 | MAE/cm | MAXE |
|---|---|---|---|---|---|
| 消落期 | 0.11 | 0.37 | 回蓄期 | 0.10 | 0.45 |
| 汛期 | 0.14 | 0.73 | 其他时期 | 0.04 | 0.27 |
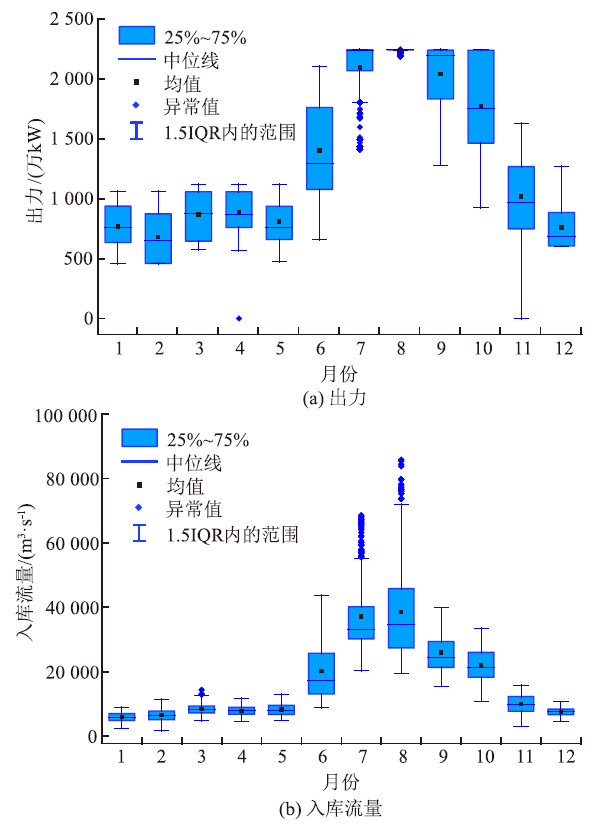
误差较大的情况主要为6月份和7月份,7月份平均误差有所降低但是预测不稳定,出现了全年的最大误差。三峡水库的出力和入库流量箱型图如图5所示。
从图5可见,误差的分布情况与出力的波动较为同步,表明出力值在模型训练过程中被判断为高权重特征变量。模型误差的来源是复杂的、多方面的,汛期时机组工况复杂,出力、流量等特征变量和水位数据都有着较大的离散,不利于模型训练,导致模型预测误差的提高,针对此问题可展开进一步研究。
3 结论
本文借助LSTM算法,构建了2类深度学习模型,并与水量平衡算法模型对比计算效果。考虑三峡库区水面线时的深度学习模型,可以使99%的预测绝对误差<40 cm,当汛期来临与结束前,数据波动浮动较大导致预测误差显著高于平均值;深度学习模型的效果远优于水量平衡算法模型,平均绝对误差降低约70%,有效避免多时段计算时的误差累积;考虑三峡库区水面线以应对动库容问题,可以提高深度学习模型效果稳定性,预测精度提升约10%。综上所述,本研究可有效提高三峡的凤凰山未来最大最小水位预测精度,能够为三发电计划的精确编制和厂内经济运行的精准执行提供支持与参考。